
Working with Analytics Objects
- Analytics Administrator
- General System Administrator
Using Analytics Objects you can subscribe to and schedule analytics reports and dashboards, you can pin reports and dashboards, and you can configure analytics reports as widgets that can be displayed on your home page. Each analytics object can be associated with a report or dashboard and then scheduled or used as a widget.
Displaying the Analytics Object List
To display the Analytics Object List, select Analytics > My Analytics > Analytics Object List. The following appears:
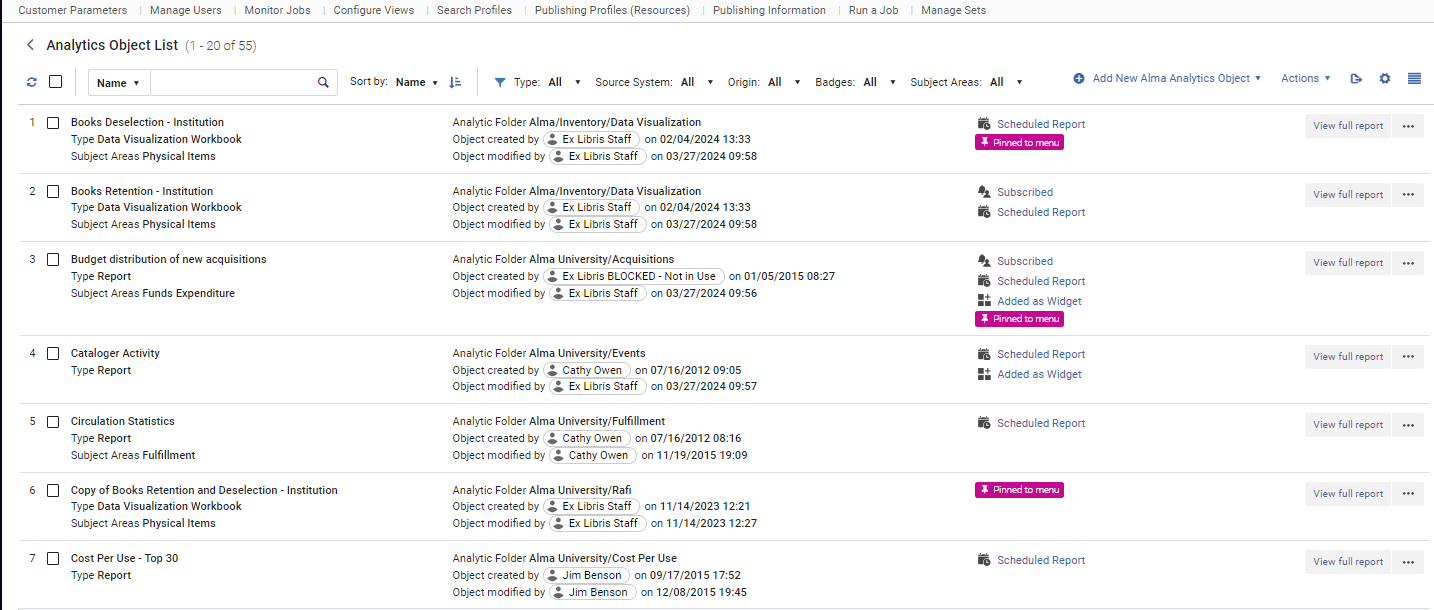
The Analytics Objects list displays your Analytics Objects. For each object, the following information is displayed:
- The name of the object, the type of the object, and the subject area being reported on
- The folder path in which the report or dashboard is located, the creator and last modifier of the object, and the dates this was done
- Whether the object is pinned and appears under Pinned Objects in the main Analytics menu and if the report is scheduled, added as a widget, and if you are subscribed to the report
Select View full report to display the full analytics report or dashboard and select the More Actions icon to remove an Analytics Object and Pin/Unpin an Analytics Object from the Analytics menu.
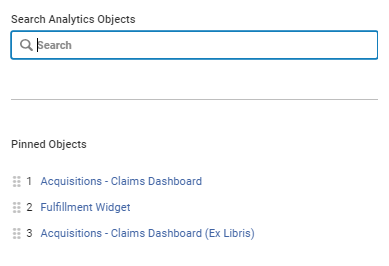
Objects you pin appear under the Analytics main menu:
To remove Analytics Objects in bulk, select the checkbox next to the objects you want to remove and select Remove Objects from the top row.
To export the Analytics Object List to Excel format, select the export icon ![]() from the top row.
from the top row.
From the top row of the Analytics Object List, you can perform the following actions:
- Search for an object by:
- Name – the name of the analytics object
- Location – the location of the report or dashboard on which the analytics object is based
- Object creator – the user who created the analytics object
- Description – the description of the analytics object
- Report Name – the name of the report or dashboard on which the analytics object is based
- Sort the list
- Filter the list by:
- Type
- Source System
- Origin
- Badges
- Subject Area
Displaying the Analytics Object List in Split View
To display the Analytics Object List in Split View, select the View Settings icon at the top right of the page or select the analytics object. The following is an example of the Analytics Object List in Split View:
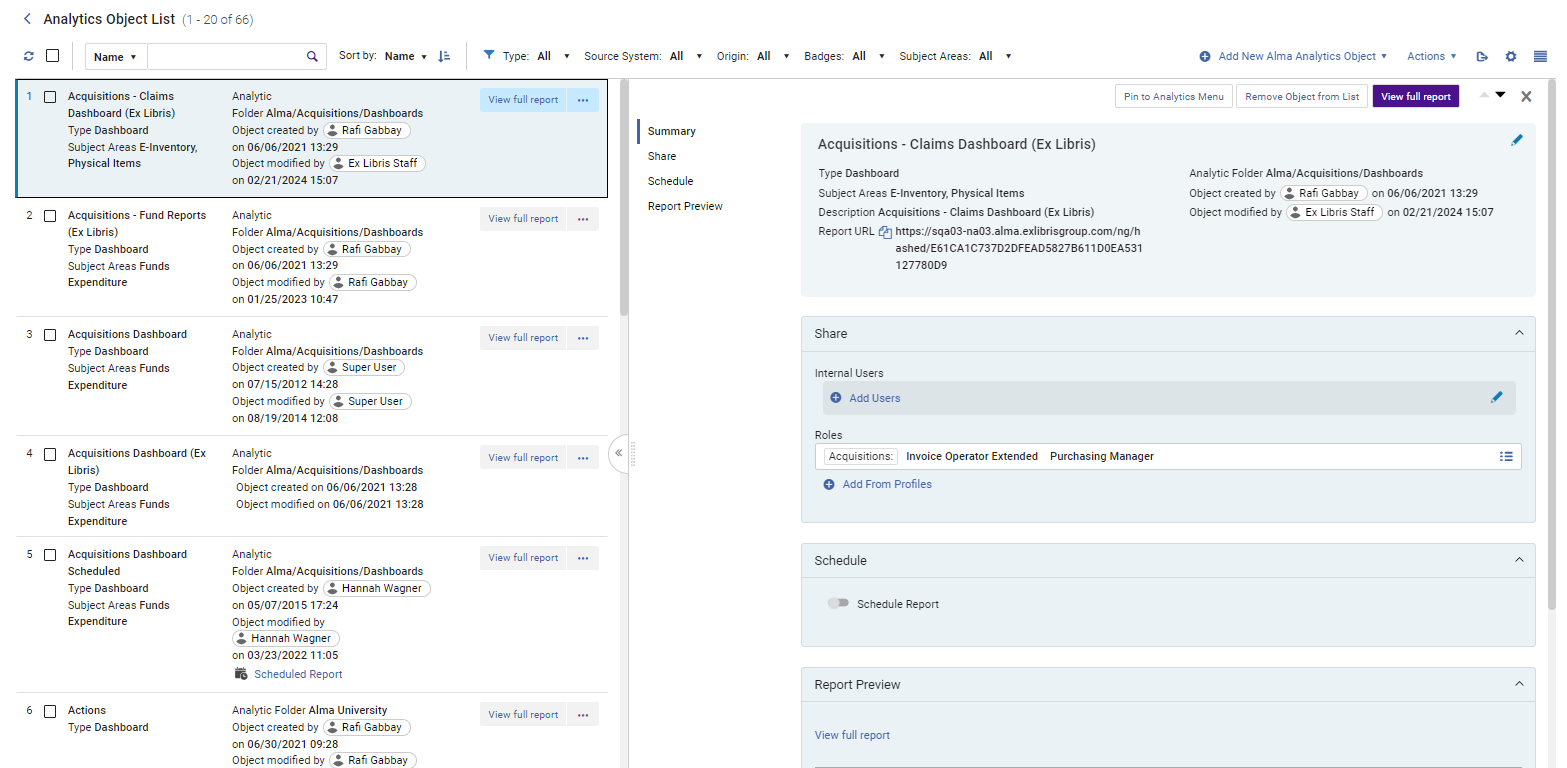
Split View allows you to edit an object in the right pane, while also displaying the List of Objects in the left pane. A preview of the report appears in the right pane that allows you to quickly see if a report is running properly.
Select the icon next to the Report URL to copy the URL. You can send it to internal users with whom you shared the report or dashboard. When the user clicks the URL, the report or dashboard is run.
Creating an Analytics Object
You can create Analytics Objects, which you can use to subscribe to and schedule analytics reports and dashboards and create widgets that can be displayed on your home page.
- Select Add New Alma Analytics Object. The following appears:
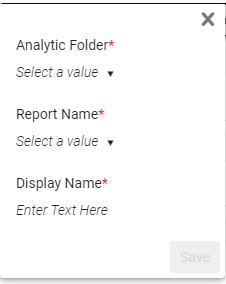 New Analytics Object
 - Select the analytics folder where the report or dashboard is located.
- Select the report name.
Out-of-the-box reports do not appear in the drop-down list when creating analytics objects, since they cannot be used to create analytics objects. If you want to share or schedule an out-of-the-box report, save the report in your institution folder with a new name and create the analytics object with that copy.
- If you want the display name to be different than the report name, select the pencil icon and edit the display name.
- Select Save. The Object Page appears where you can edit the analytics object:
 Object Page
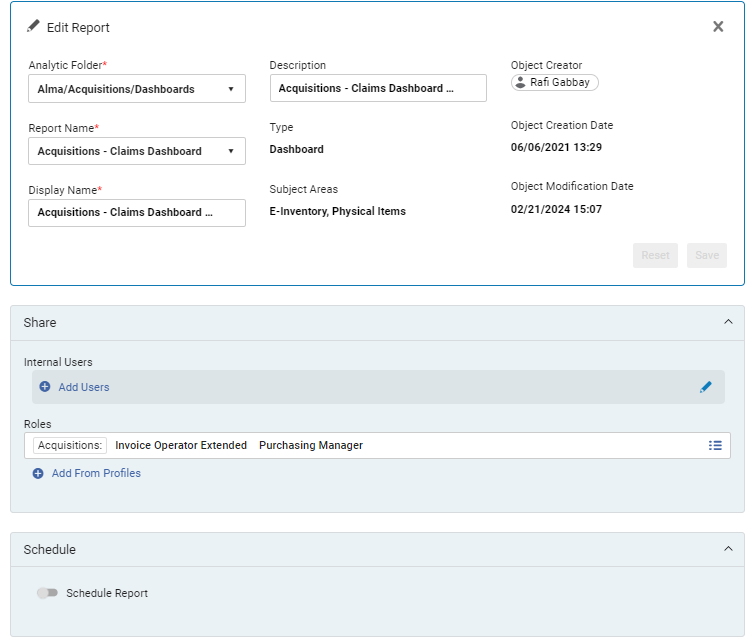
Editing the Report Summary
You can edit the report summary area of the analytics object you created by selecting the Summary area. The following fields become editable:
- Analytics folder – select another report location for this object
- Report Name – select a report for this object
- Display Name – edit the name displayed in the Analytics Object List and the name displayed to subscribers
- Description – edit the description for this object. If the report has a description in analytics, that description is displayed. You can edit the description of the object; however, the description in analytics is not changed. Similarly, if the description is changed in analytics after the object is created, the description in the object is not changed.
Sharing Analytics Objects with Other Users
You can share the report or dashboard associated with an analytics object with other users from your institution. (See Creating an Analytics Object.) The users access the shared report or dashboard from a direct link sent to them in an email or from the Shared with Me list.
From the Internal Users area, you can add users to receive the report or dashboard.
From the Roles area, you can add roles and profiles to configure who can subscribe to the report. Users must have at least one of the roles defined for the object to subscribe to or view the object.
Users can see the reports that are available to them by selecting Analytics > Shared With Me.
Scheduling and Subscribing to Reports and Dashboards
You can schedule reports and dashboards to be run on a specific schedule and subscribe users to receive them.
- From the Schedule section, toggle Schedule Report to display the default scheduling settings:
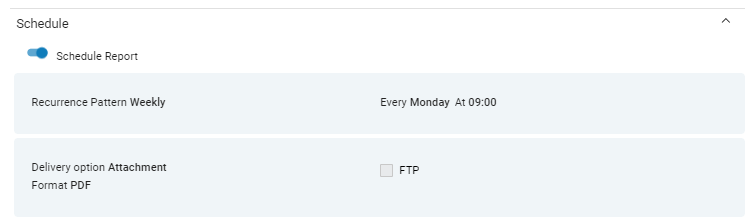 Schedule Report
 - Edit the scheduling and delivery options. The following appears:
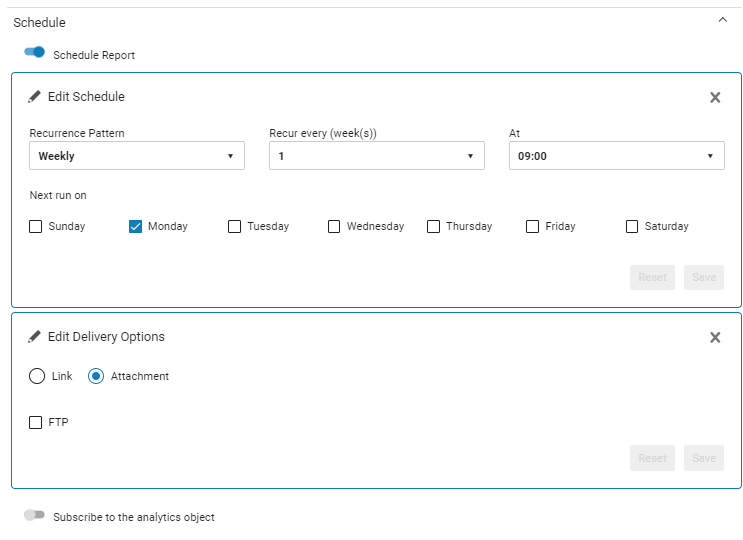 Scheduling and Delivery Options
 - Schedule how often you want the report to run and be sent. Select if you want the report run hourly, daily, weekly, or monthly. The relevant options appear according to your selection. Users with the roles you indicated in the Roles section receive the report.
Each scheduled report job is listed separately with the name of the report on the Monitoring Jobs page (Admin > Manage Jobs and Sets > Monitor Jobs).
- Select whether you want the report sent as an attachment or just as a link to the report. If you select Attachment, select the format in which you want to report to be sent.
- When selecting Attachment for dashboards, only the first tab of the dashboard is included in the attachment. It is recommended to send dashboards as a link.
- When scheduling data visualization reports, only the link option is available.
- To configure the report to be sent to an FTP server, select FTP and select the FTP configuration and the sub-directory. Select Add Timestamp to include a timestamp in the file name. This prevents the file from being overwritten the next time the report is run.
- When sending the report by email, if the file size is over 2MB, it is compressed into a zip file. The maximum size of the compressed file is 7 MB. There is no limit to the file size when sending the report by FTP.
- For information on configuring an FTP server, see Configuring S/FTP Connections.
- To subscribe people to the object, select Add Subscribers. The following appears:
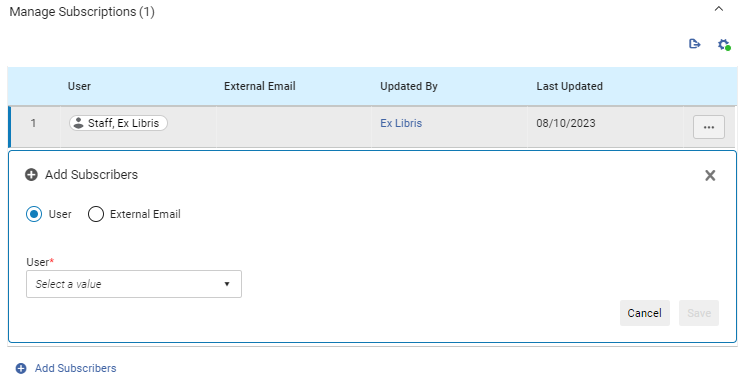 Add Subscribers
 - To add an internal user, select User and enter the name of the user in the text box. To add a user with an email address, select External Email and enter the email address of the user. External email addresses are validated for proper format and if they are already in the list.
- Select Save.
- To subscribe yourself to receive the report, toggle Subscribe to the analytics object.
The users you subscribe appear in the list. You can customize the columns that appear by selecting the Customize icon ![]() and export the list to Excel by selecting the Export icon
and export the list to Excel by selecting the Export icon ![]() .
.
Displaying A Report Preview
From the Report Preview section you can view a preview of the report without having to open it in the analytics interface. To open the report in the analytics interface, select View full report.
If the Analytics Object is a report (and not a dashboard), you can select the Add as widget checkbox to have the object available to be added to the homepage in Alma.
If the Analytics Object is a Data Visualization workbook, you can select the Add as a Homepage Dashboard checkbox to have the object available to be displayed as the homepage in Alma. For more information on configuring a Data Visualization dashboard as the Alma homepage, see The Navigation Bar.
Customizing the Analytics Object List
You can now customize many elements of the Analytics Object List and determine which section appear and in what order. To customize the Analytics Object List, select the customization icon ![]() at the top right of the page. The following options are available that enable you to configure the sections of the edit view, the actions available for the records, and the elements displayed in the record view:
at the top right of the page. The following options are available that enable you to configure the sections of the edit view, the actions available for the records, and the elements displayed in the record view:
- Sections Customization
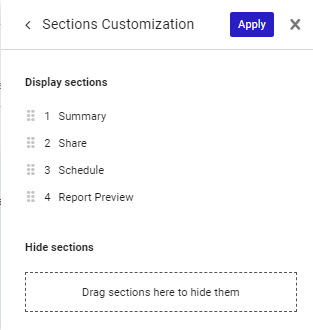 Sections Customization
You can perform the following customizations:
- Drag and drop the elements to reorder them.
- Drag the elements to the Hide area to have them not displayed.
- Select Reset to default to remove all of your customizations.
- Actions Customization
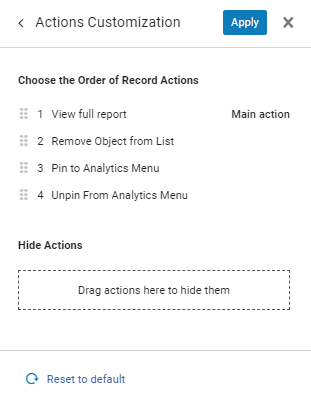 Actions Customization
You can perform the following customizations:
- Drag and drop the elements to reorder them.
- Drag the elements to the Hide area to have them not displayed.
- Select Reset to default to remove all of your customizations.
- Records Customization
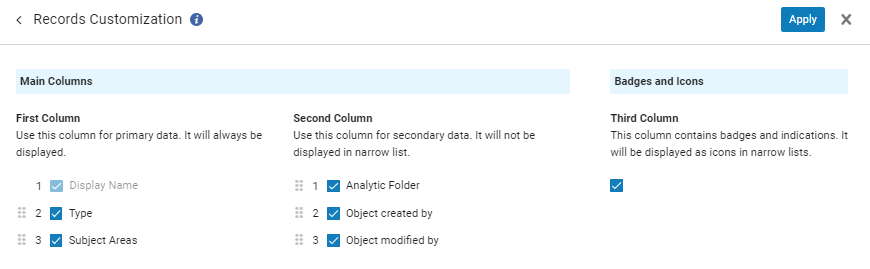 Records Customization
You can perform the following customizations:
- Drag and drop the elements within each column to reorder them.
- Select the checkbox next to an element to have it appear. Clear the checkbox to hide it.
- Select Reset to default to remove all of your customizations.
Select Apply to implement your customizations.