360 Services, Intota Assessment: Introduction and Overview of the Intota Assessment Platform
- Product: 360 Core Client Center
What reports does my library have access to on the Intota Assessment platform?
Welcome to the Intota Assessment platform, the single place to access usage information and other statistical data across Intota and 360 services. Log in either by being passed through via Intota or the Client Center, or by logging in directly to Intota Assessment:
Pass Through Authentication
-
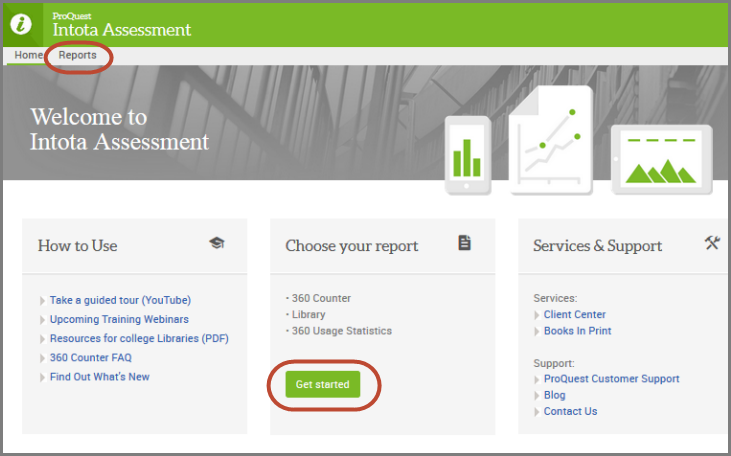
Intota users: Click the Intota Assessment link on your Intota home page and you will be taken to the Welcome page displayed below.
-
Client Center users:
-
All users can access Intota Assessment by clicking the 360 Usage Statistics link within the Business Intelligence Tools section of the Client Center home page.
-
360 Counter users have the additional Intota Assessment button on the 360 Counter Landing Page in the Client Center.
-
Log In Directly
-
To log in directly you can log in to http://intota.proquest.com/ with your Intota or Client Center login credentials.
For a list of Intota Assessment supported web browsers see Supported Browsers for ProQuest Management and Discovery products.
After you have logged in, use the Reports link in the top left or the Get Started button to access the reports:

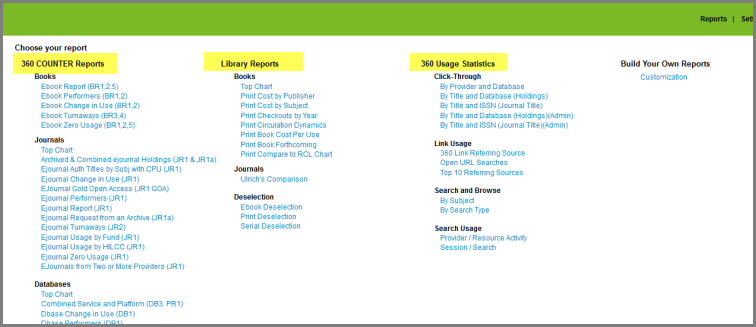
Depending on the ProQuest management and discovery services your library subscribes to, the Intota Assessment reports page will display up to three columns of reports:
-
360 COUNTER Reports
-
Library Reports
-
360 Usage Statistics

360 Usage Statistics
All libraries will see the above 360 Usage Statistics column of reports. Use these reports for insight into use of your library collection through ProQuest resource discovery tools:
-
360 Link
-
360 MARC Updates
-
360 Search
-
E-Journal Portal
-
Journal Linker
Details about these reports are available in 360 Usage Statistics.
Note that libraries subscribing to Ulrichsweb periodicals directory will also see a column of Ulrichsweb Usage Statistics reports on the right side of the page. Details about these reports are available in Ulrichsweb Usage Statistics.
360 COUNTER Reports
Libraries that subscribe to the below services will see the 360 COUNTER Reports column in the above screenshot:
-
360 Counter
-
Intota
-
Intota Assessment
These reports let you analyze e-resource usage through any of the interfaces you offer to your patrons, such as the native database interfaces and ProQuest discovery services. Also available are accreditation reports for ACRL (Association of College & Research Libraries) and SCONUL (Society of College, National, and University Libraries) accreditation purposes. Note that in order for these reports to generate information about e-resource usage at your library, COUNTER reports from providers need to be uploaded to your library's Intota or Client Center profile. For more information about uploading COUNTER reports: Intota users click here; Client Center users click here.
For more information see the below Support Center articles about 360 COUNTER reports:
-
Platforms (see Platform Report (PR1) in the Databases reports area)
Note that libraries with 360 Counter, Intota, or Intota Assessment also have the Build Your Own Reports section seen on the right side in the above screenshot.
-
This customization tool lets you create, from scratch, reports currently not available in 360 COUNTER Reports. Given that the customization tool provides the ability to create reports from scratch, its display of metrics, hierarchies, and calculations will likely be best suited for users with previous experience creating reports on a technical platform. See further documentation: Intota Assessment: Build Your Own Reports.
Library Reports
Libraries that subscribe to the below services will see the Library Reports column in the above screenshot:
-
Intota
-
Intota Assessment
These reports let you analyze print usage through your library catalog. Note that in order for these reports to generate information about print usage, libraries need to have uploaded their ILS files (including bibliographic, holdings, item, circulation, and acquisitions data). If a report title is followed by (Item Level), the report includes holdings data (local call numbers and Item/Holding ID). Otherwise, report data is at the title-level, not the item-level.
Also available are deselection reports to enable "smart weeding", and peer analysis reports for comparing your collection to other libraries that have opted-in to be included in Peer Analysis.
For more information see the below Support Center articles about Library Reports:
- Date Created: 20-May-2014
- Last Edited Date: 1-Feb-2016
- Old Article Number: 10757

