General
What reporting and statistical options are available in Alma?
Alma Analytics is used for the generation of a variety of reports, as well as for generating statistics from various library activities. Analytics is built into Alma throughout the system and is very flexible. Alma comes with a wide range of preconfigured reports and dashboards, all of which are customizable. In addition, designated staff may create reports of interest to other roles within the library and provide dashboards for staff, enabling them to access the defined reports.
Alma’s analytics function provides a Business Intelligence solution centrally installed on Alma servers in the cloud. The solution serves all Alma customers, but the data of each institution is separated from other institutions, based on the Alma SaaS model. Alma Analytics is designed to work over the Web and in the cloud so libraries can run out-of-the-box reports as well as create and run ad-hoc reports without the need for third-party reporting tools. Consortium members also have the ability to run reports on the level of the network.
Alma Analytics provides a full suite of capabilities for creating and exposing reports, and presenting dashboards of summary data using this tool:
- From screens within Alma;
- From dashboards specifically tailored to a particular staff role;
- As widgets that are accessible from lobby areas within Alma; and
- As pushed reports, sent to the interested staff as emails.
All reports can be exported in CSV, Excel or PDF.
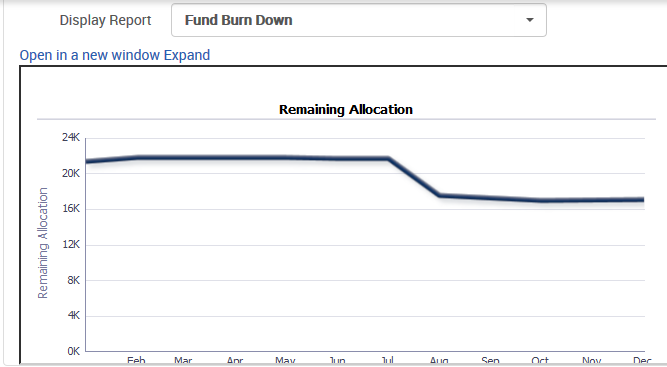
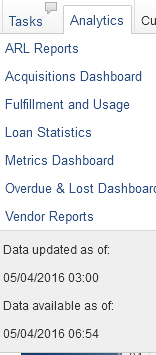
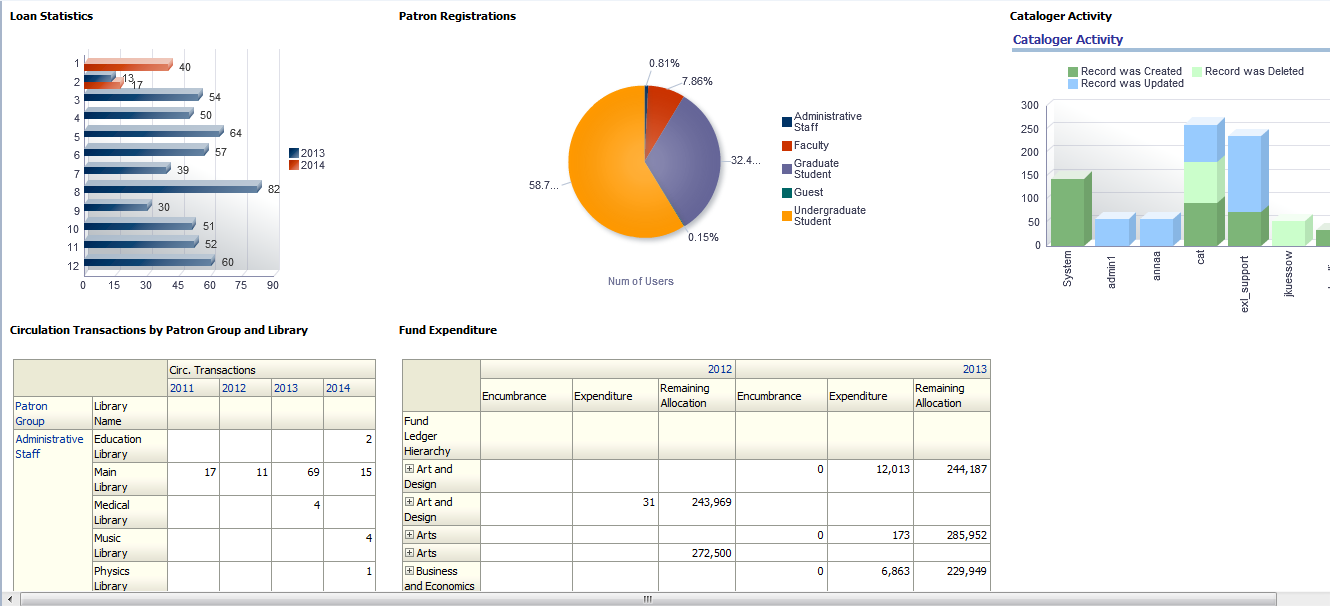
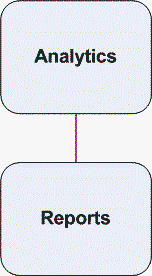
In addition to the out of the box reports, Alma Analytics includes embedded reports as shown below:
Alma analytics includes data from different business areas (such as funds expenditure, loans, acquisitions, bibliographic data and more) and was built in mind both for operational day to day reports such as outstanding orders by supplier\fund\material type or a fund transaction report as well as for more analytical, decision support reports, such as most frequently used and least frequently used journals.
Alma roles determine which users can create reports (report designers) and which users can only view reports (report consumers).
Alma provides for the automated dissemination of reports. For example, library staff can schedule a report to run periodically; authorized staff may then subscribe to the report and receive the output in an email sent automatically based on the report schedule (e.g. daily, weekly, monthly). In this way, a staff member can get to his/her email report at fixed intervals without the need to log into Alma.
How often is data exported from Alma to Alma Analytics?
A snapshot of data is taken from Alma every 24 hours. The ETL process then takes place. An example of the daily status: “Data updated as of: 12/06/16 02:00. Data available as of: 12/06/16 06:05”
Are all Alma fields included in Alma Analytics?
No, all Alma fields are not included in Alma Analytics. The decision to selectively include fields is based on several factors, including data governance and performance optimization. By curating the available fields, Alma Analytics ensures that users receive meaningful insights without compromising system performance.
- Data Governance:
- Alma Analytics aims to provide meaningful insights to users. By selectively including relevant fields, the system ensures that reports and dashboards remain focused on essential information. For example, some fields in Alma can have multiple values or are hierarchical. Adding these fields to Analytics can result in complex data structures that are difficult to include in reports.
- Adding all fields could introduce noise and clutter, making it harder for users to find the data they truly need.
- Performance Optimization:
- Adding all fields to Analytics could burden the system with excessive data. This can impact performance, causing slowness and affecting the overall user experience.
- By selectively choosing which fields to include, Alma ensures that the most valuable and relevant information is available in Analytics without compromising system performance.
You can request the addition of Alma fields to analytics in one of two ways:
- Idea Exchange: Submit your ideas for adding new fields to Alma Analytics through the Idea Exchange platform. This allows you to share your suggestions with the community and vote on ideas proposed by others. The Alma Product Team actively reviews and addresses highly voted ideas.
- Community of Practice: Customers can also engage with the Community of Practice, which maintains close collaboration with Alma Product teams. Regular communication ensures that customer feedback and needs are considered in product development.
In summary, Alma’s approach balances the need for comprehensive data with system performance considerations. By selectively adding fields, Alma ensures that Analytics remains efficient and provides valuable insights to users. Users can actively contribute to field selection through the Idea Exchange or engage with the Community of Practice.
How does Alma support reporting on activity in the library?
Alma includes advanced data analytics, Alma Analytics, based on a worldwide leading Business Intelligence platform: Oracle Business Intelligence Enterprise Edition (OBIEE). Alma Analytics is fully integrated into Alma and transparent to the end user.
The data warehouse is organized into subject areas which are designed as a star schema and which classifies the attributes of an event into facts (measures) and descriptive dimensions.
The benefits of a star schema are:
- Simpler queries - star schema joined logic is generally simpler
- Simplified business reporting logic
- Query performance gains - star schemas can provide performance enhancements for read-only reporting applications
- Fast aggregations - the simpler queries against a star schema can result in improved performance for aggregation operations
Reports which cross subject areas are possible through dimensions, which are shared by multiple subject areas. For example, Classification is a joint dimension of Expenditure and Circulation subject areas so it is possible to create reports that match expenditure and usage of a specific location.
All reports are exportable in PDF and HTML format. In addition, each component within a report (chart, table etc.) can be exported in a variety of formats including Excel, XML, CSV. In addition, reports can be scheduled to be sent as email outputs to authorized staff on a regular basis.
What options are there for combining data elements for reporting?
Data elements and subject areas in Alma Analytics can be combined.
There is however a minor limitation, and that is a relational database restriction:
It is not possible to combine different subject areas if there is not a common dimension with measures.
However, to overcome this, Alma Analytics has added dimensions from many subject areas to other subject areas.
For example fund information from the "Funds Expenditures" subject area has been added to the "Physical Items" subject area.
Similarly, "Course Reserves" information has been added to the "Fulfillment" subject area.
Can SQL be used in creating reports?
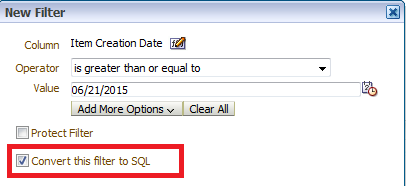
All queries in Alma analytics can be converted to SQL and retrieved via SQL. For example:
In the first screenshot items created on or after June 21 2015 will be retrieved.
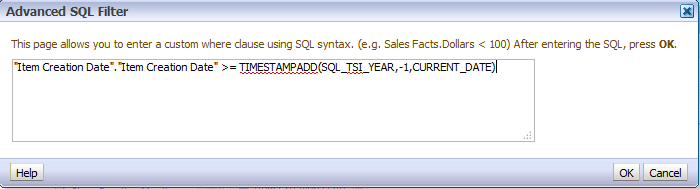
In the second screenshot items created a year or more ago will be retrieved.
This is an automatic SQL filter whereby it will always be "one year ago" regardless of when the report is run.
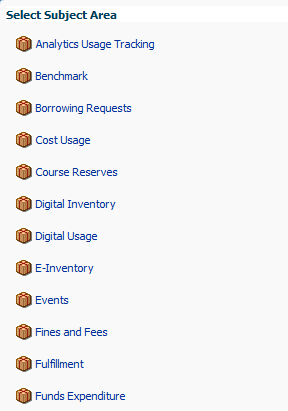
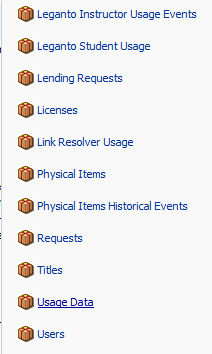
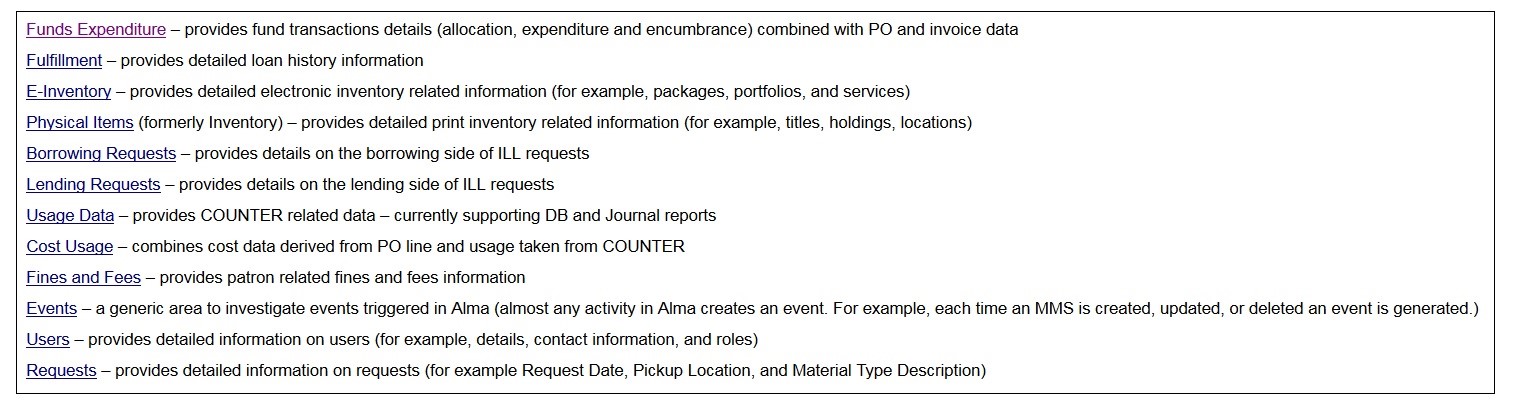
Can Alma produce reports on all data held?
Analytics is built into Alma throughout the system. The following illustrates the “subject areas” available for reporting :
Can patron information be anonymized in analytic reports?
Fields that contain identifying information of users can be anonymized when creating Alma Analytics reports. Anonymizing this data allows the library to generate reports for statistics and trends without violating privacy concerns or local privacy-related laws.
If the parameter analytics_anonymize_user_details is set to true then when you create a report, fields that usually contain identifying information for users are left blank.
What documentation related to report creation is available?
Ex Libris provides training and detailed documentation and examples to help users create custom reports. Besides using and customizing the many out of the box reports, staff can also create new reports to provide the institution with information on library activities. The simplest way to create a report is based on one subject area. There are cases in which you need to combine data from more than two subject areas, which is a more complex process that requires understanding of the data dependencies. Detailed instructions are provided in the documentation.
Field descriptions for the various subject areas in Analytics are available in the documentation, which is now openly available on the Ex Libris Knowledge Center
Ex Libris also offers additional Expert Services for libraries that are already in production. During an Expert Service engagement, a product expert may analyze opportunities for workflow efficiencies, set up new services, or build custom reports. These and other services can be adapted as the library’s unique requirements develop.
Does Alma provide real time data reporting?
Reporting that is run from within the Alma interface, as opposed to using the Alma Analytics functionality is real time. Alma Analytics is based on a data warehouse created from the online transaction databases and does not run any queries directly on the operational system. This means that there is no interference with the operations of the system.
Data is refreshed on a daily basis from the operational data into Alma Analytics.
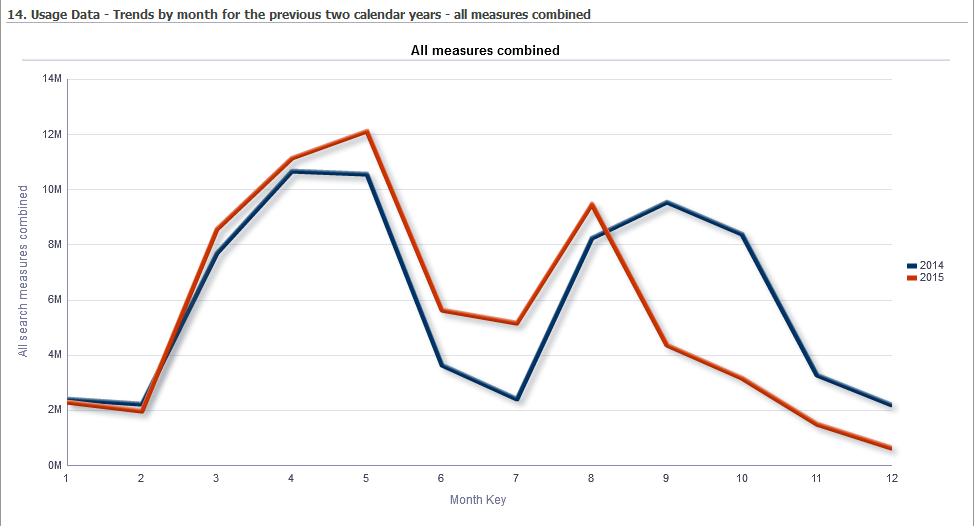
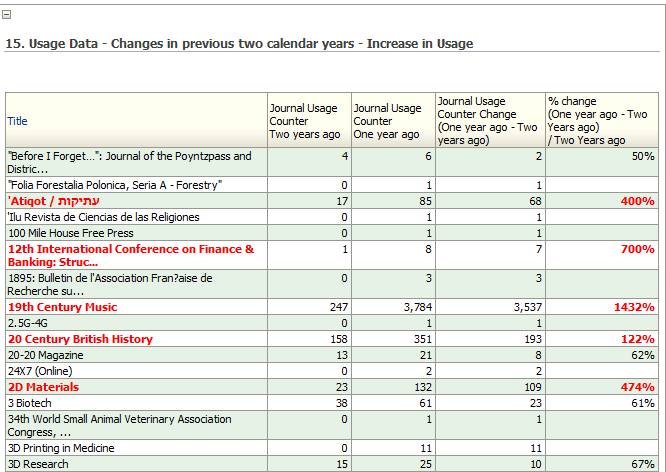
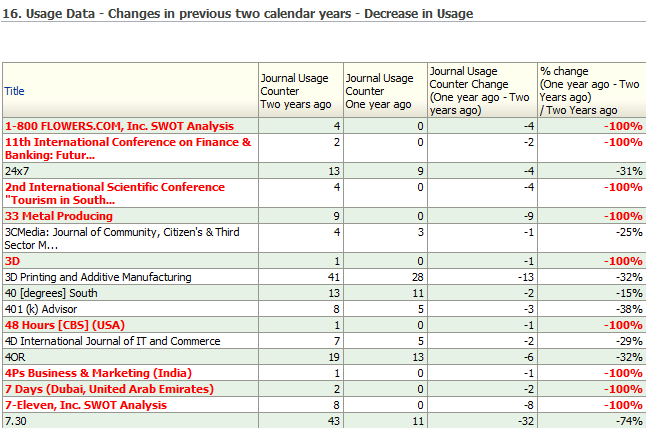
Can Alma analyze trends in historical data?
Historical data can be analyzed in all areas such as electronic usage, physical usage (loans etc.) and expenditures as well as "cost per use".
Below are three screenshots showing:
- Overall electronic usage for the past two years by month.
- Electronic usage for which there has been an increase in usage in the past two years.
- Electronic usage for which there has been a decrease in usage in the past two years.
Can reports on cataloging activity be generated?
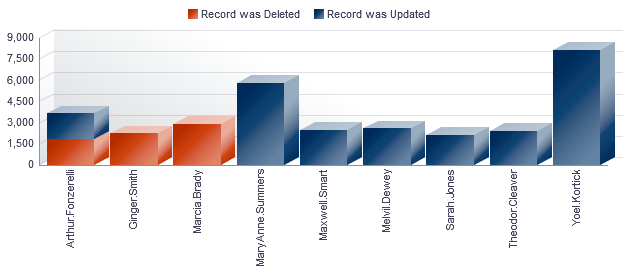
Alma contains an out of the box report called ‘Cataloger Activity’ which includes a table and graph of cataloger activity showing staff users and how many records they created, updated and deleted (top ten). The year filter is prompted.
Is an analytics API supported?
The Analytics API returns an Alma report (in XML format only). This
blog provides additional information on how to determine your reports' paths and how to apply pagination or filters.
Since Alma Analytics reports can be very large, Alma supports retrieving it in several parts: The first retrieval will return a Resumption Token as part of the OBI report. This token should be used as a parameter instead of the path parameter for the next retrievals in order to get the next rows. See here for more details.
https://developers.exlibrisgroup.com...apis/analytics
Report Creation
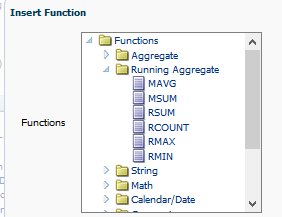
What domain aggregate functions does the solution support
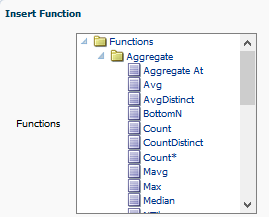
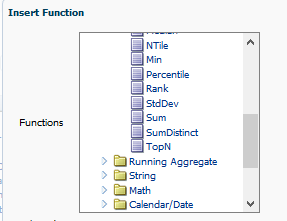
Question: What domain aggregate functions does the solution support (e.g., sum, count, min, max, etc.)?
Answer: All aggregate functions supported by OBI are supported by Alma Analytics. See:
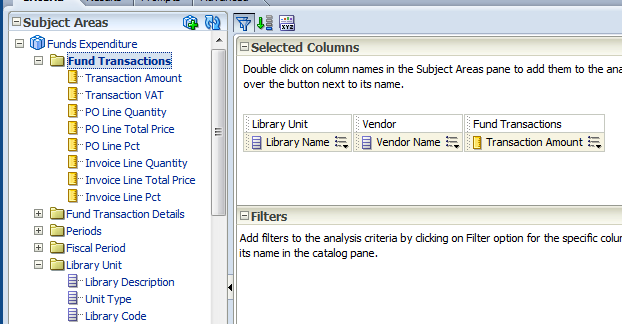
Are reports easy to create?
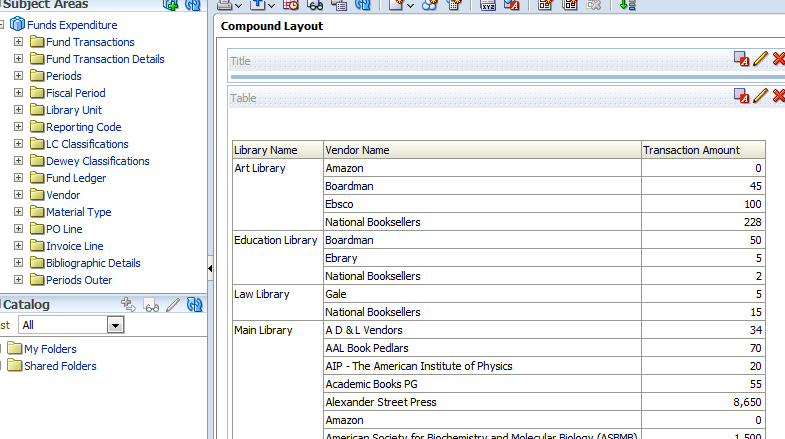
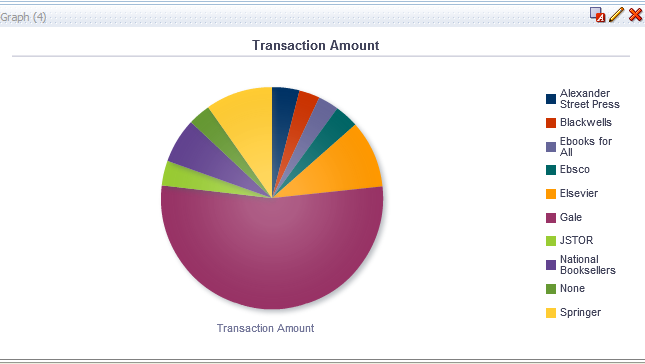
Creating a report is simple; after choosing the relevant subject area the staff user drags and drops relevant fields from the subject area on the left, to the right hand pane. Results can be viewed, and filters and other options can be applied in order to give the desired outcome. A graphic representation can be added, or chosen as the final report output.
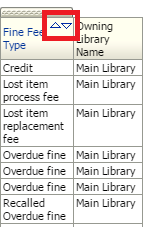
Can the report output be sorted?
Alma Analytics provides sort mechanisms. You can directly sort columns ascending or descending:
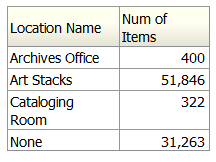
How can NULL values be reported?
Analytics allows for special treatment related to the case of NULL values across all fields, making sure that data is always displayed even when a specific data is missing. In the example given below all items that have no location information will be displayed under “unknown”/”none” category:
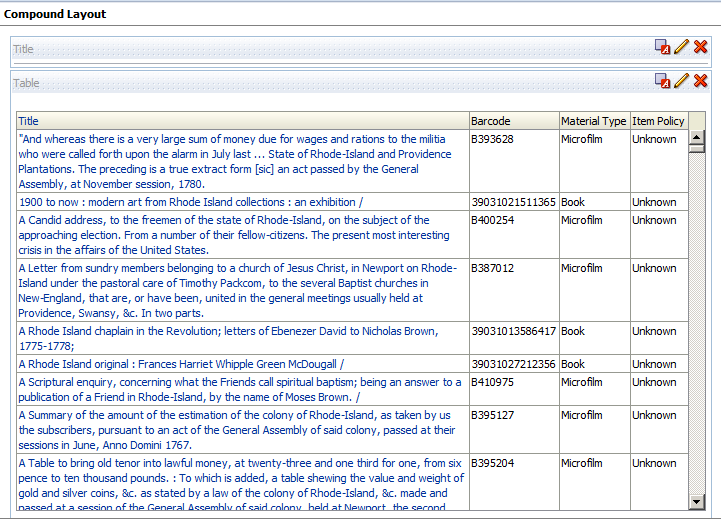
The following is an example of a report output that has been filtered to display items that have an ‘unknown’ item policy:
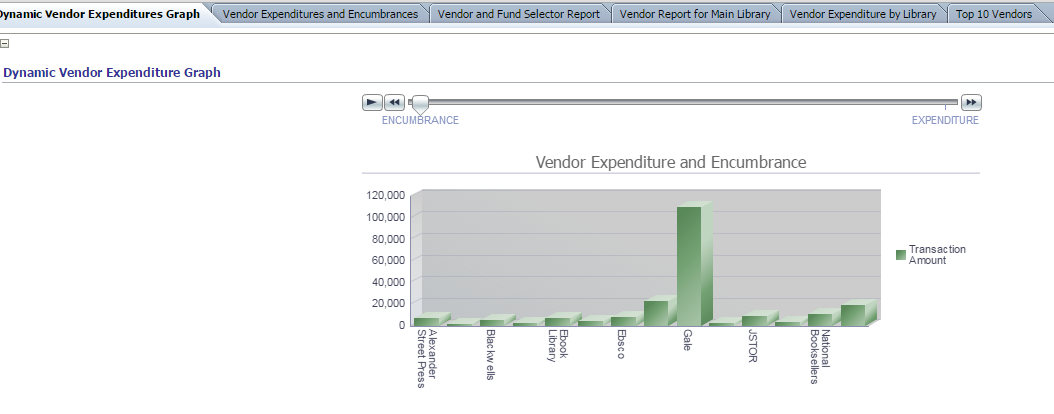
Can a dashboard incorporating different report areas be generated?
Dashboards provide a useful tool for gathering a number of reports together for easy viewing. The dashboards can be tabbed so the user can navigate from one tab to the next in order to review report outputs. An example of a Vendor Expenditures dashboard can be seen following:
An example of a metrics dashboard with a variety of report outputs:
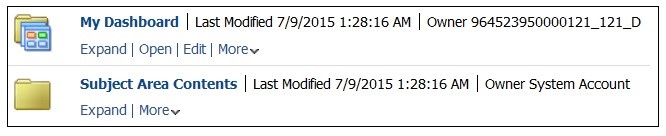
Is an audit trail generated on reports?
Each report is listed in its folder with a date stamp of the last modification stamp and the name of the owner. The name used may refer to the ID number of the staff member.
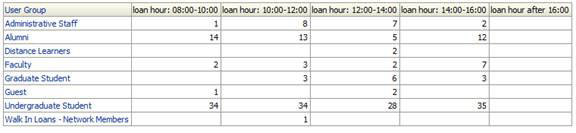
Can reports based on time stamps be generated?
Where appropriate date definitions are very flexible including date, day, month, week, quarter year and even time.
An example of this is the report below showing the number of loans by patron group within defined hour ranges.
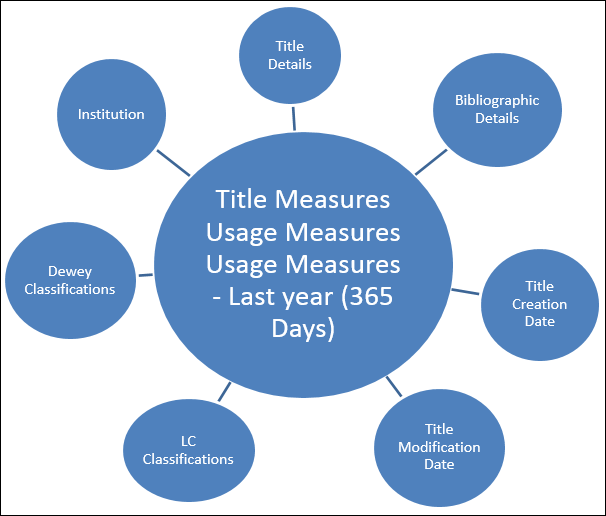
Can Alma generate reports on the level of the title?
The Titles subject area, allows the user to create reports/dashboards relating to Titles and answer the following types of business questions:
- What is the best way to link physical holdings with portfolios in order to get a good collection representation?
- What is the usage for specific bibliographic records in the library?
- How can I run a report at the title level that does not have physical items?
- Can event data be associated with bibliographic and holdings records or only with items?
- How can I report on new acquisitions?
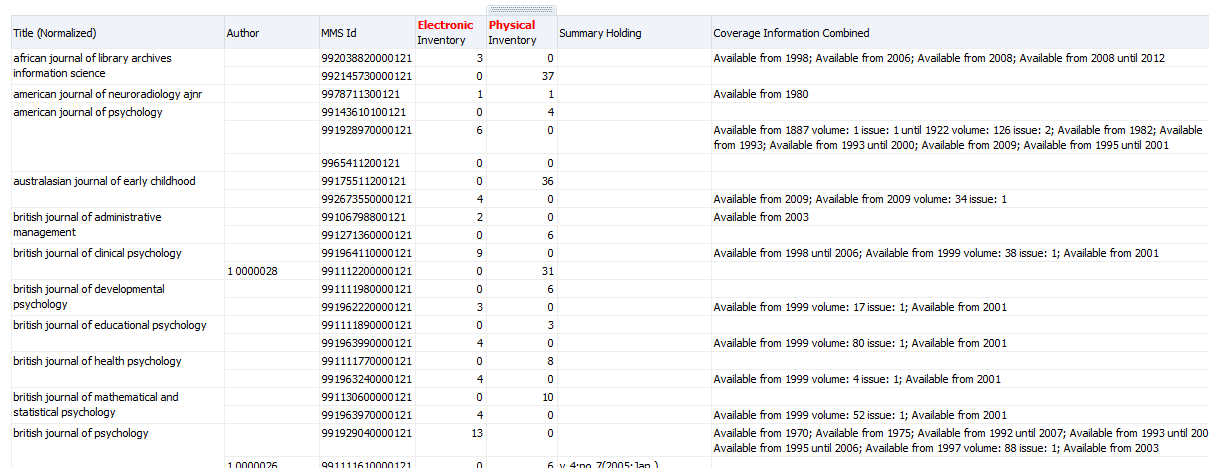
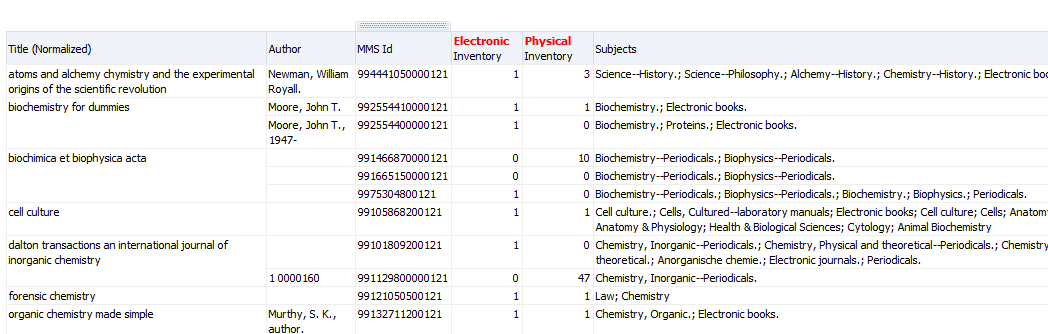
An example of an overlap report (Physical and Electronic) created on journal titles:
An example of an overlap report (Physical and Electronic) created on words in the subject field:
Can SCONUL reports be generated?
Alma’s Analytics supports data required for a number of industry standard benchmarking reports such as SCONUL, ARL and CAUL. The reports, designed by Ex Libris and by participating institutions, are available to all Alma customers via the shared reports feature.
The Industry Statistics dashboard which contains sample reports may be useful if your institution needs to send reports to library organizations such as ARL and SCONUL. The dashboard contains the following reports:
-
Number of Objects
-
Items Added, Items Withdrawal
-
Item Count by library and Location
-
Number of Loans and Renewals
-
Inventory – Physical Inventory Count
-
E-Inventory – Electronic Inventory Count
-
Fulfillment – Annual Count of Loans and Renewals
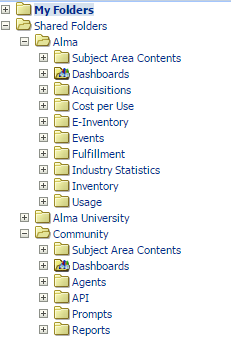
Can customized reports be saved for reuse?
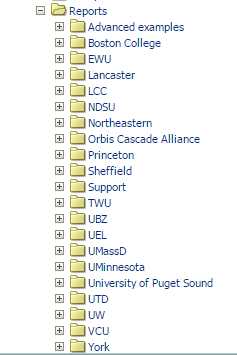
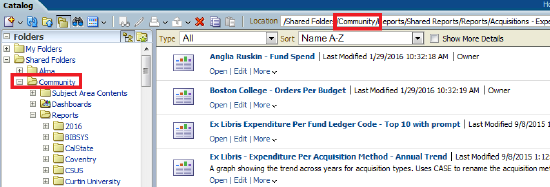
In addition to the institution folder (Alma University in the screen capture below), there is a Community area, that allows staff from all Alma institutions to post reporting options that can be shared by the entire Alma Community. An example of this can be seen in the following screen captures:
Community Reports:
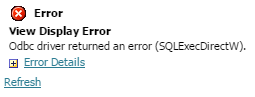
Are failed reports logged with easily understood messages?
Alma Analytics supports logging of failed reports:
Report Distribution, Dissemination
Is viewing reports in Alma role-based?
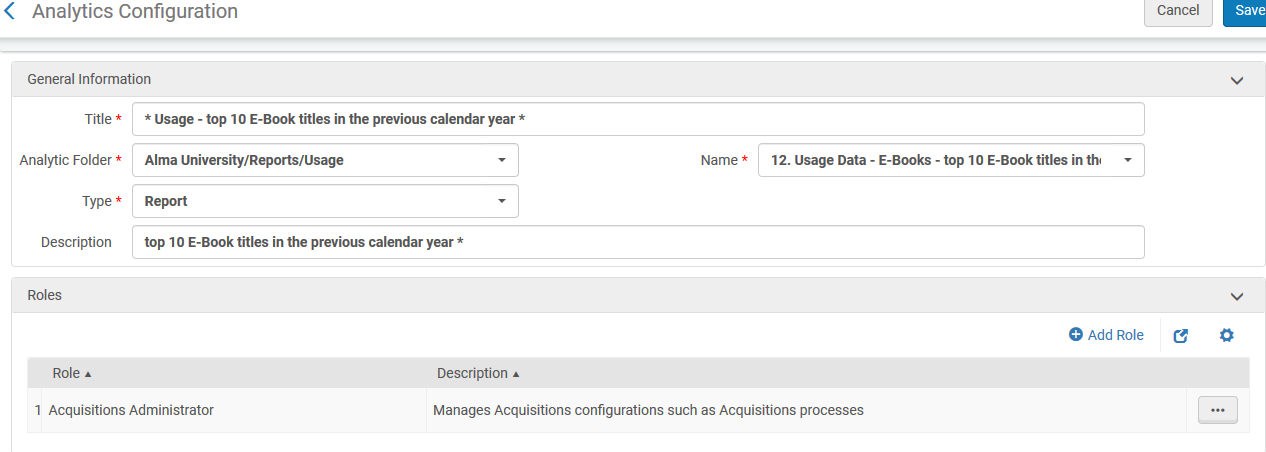
Viewing reports in Alma is role based - for example only staff users with acquisitions roles and privileges will be able to view acquisition reports. Defining reports, widgets or dashboards requires also defining the roles that can view these outputs.
The following screenshot is for a report, that only a user with roles "Acquisitions Administrator" can view.
How are reports disseminated?
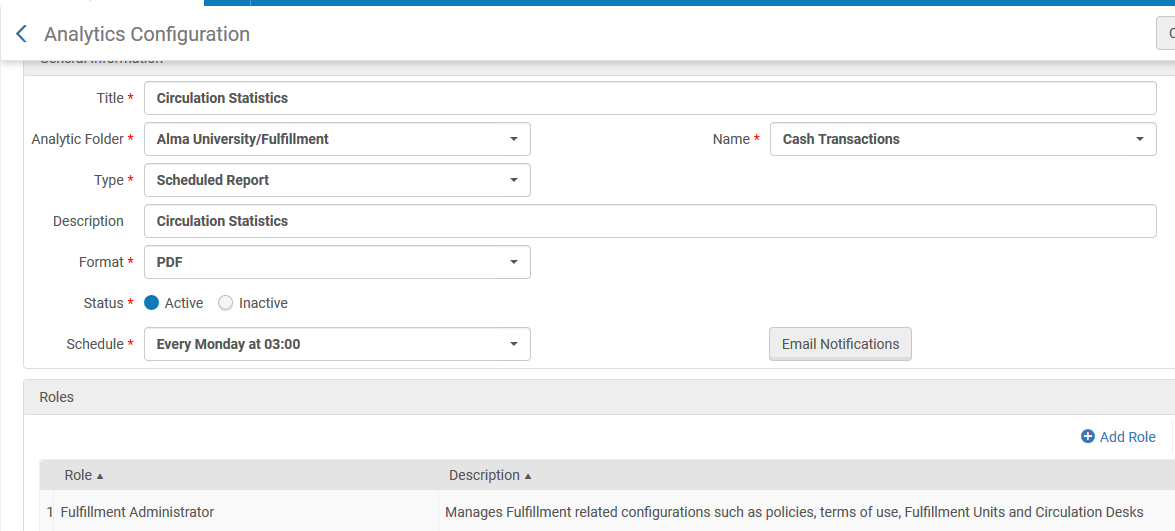
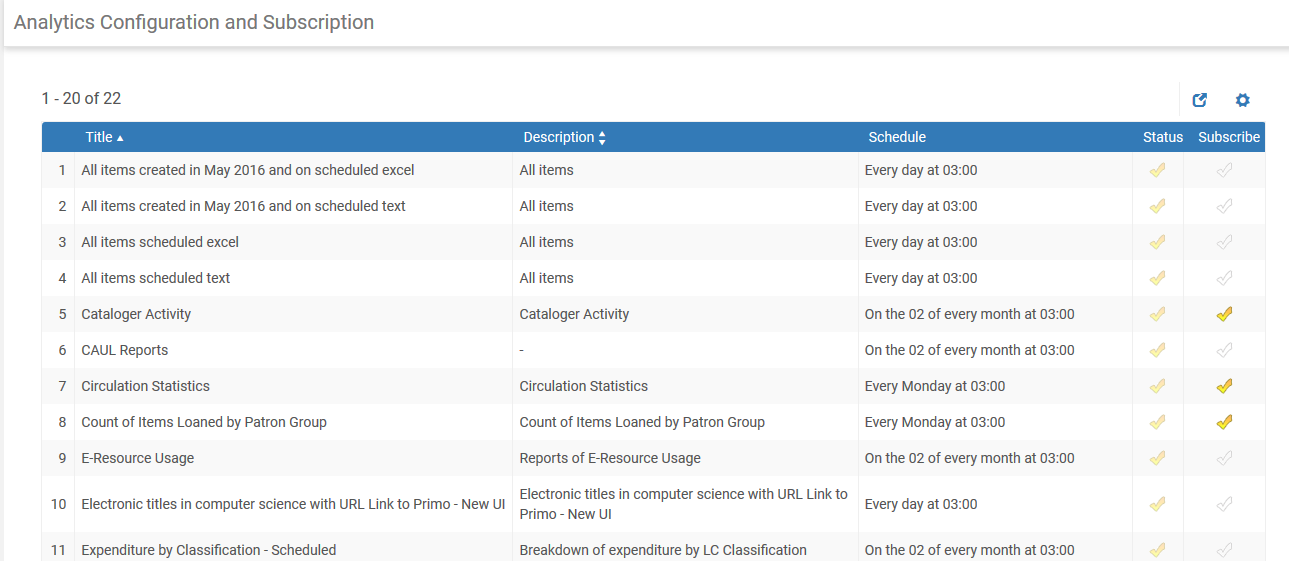
Alma provides for the automated dissemination of reports on a scheduled basis. Library staff can schedule a report to run periodically; authorized staff may then subscribe to the report and receive the output in an email sent automatically based on the report schedule (e.g. daily, weekly, monthly).
Dashboards can be accessed by authorized staff from Alma.
Staff users with roles linked to a report or dashboard, may choose the reports that he/she wishes to subscribe to. These will be emailed to subscribed staff at defined intervals.
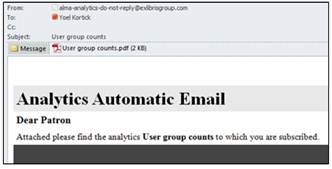
The following is an example of a scheduled report sent to an email address:
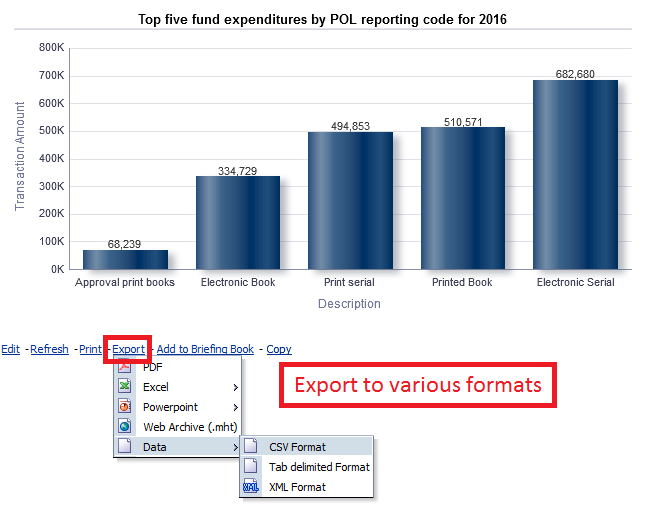
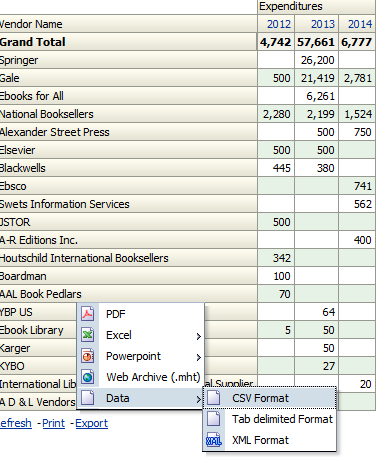
Can reports be exported in different formats?
All reports are exportable in a variety of formats including: PDF, Excel, PowerPoint, mht, csv, tab delimited and xml.
See for example the two screenshots below which demonstrate this for both a graph and a table
Report Sharing
What options are available for report sharing and collaboration?
Alma Analytics enables sharing of out-of-the-box reports created by Ex Libris. In addition, there is a Community area, that allows staff from all Alma institutions to post reporting options that can be shared by the whole Alma Community. The "Community" folder is a read / write folder visible and accessible to save and copy for all institutions. It includes reports and dashboards made by and to be used by all institutions in the world. It contains only queries (no data of other institutions is visible).
An example of this can be seen in the following screen capture.
Alma Analytics Export General Comments
The purpose of Alma Analytics is for obtaining trends and statistics so that evidence based decision making can be made on library processes.
If the institution desires to export large amounts of data from Alma then there are multiple process to do so, and they should be used instead of Alma analytics.
For example:
- The general publishing profile allows the institution to export a set of bibliographic records which could theoretically contain the entire catalog and then continue to automatically run with incremental changes. This export can include all bibliographic fields as well as information of related inventory such as portfolios, electronic collections, physical items and digital objects. It can be run manually or scheduled to run on a regular basis and export to an ftp server.
- Users can be exported using the integration profile of type users. All users can be exported, or they can be exported according to various conditions.
- Fines and fees can be exported using the integration profile of type bursar. All fines and fees can be exported, or they can be exported according to various conditions.
- URLs of bibliographic records, electronic resources and digital titles can be done using the job "Export URLs"
- Physical items can be exported using the job 'Export physical items'
- Digital titles can be exported using the job "Export digital titles"
- Local authority records can be exported using the job "Export authority records"
There is a 10,000,000 line limit for exports of Alma Analytics reports in csv format. The limit is in place in order to ensure the efficient use of OBI with the multi-tenant cloud environment.
Total views:
11970