Benchmark Analytics
|
What support is there for benchmark analytics?
Alma supports benchmark analytics.
The overall goal and idea of benchmark analytics is for the institution to identify:
- Where in their workflows improvements can be made
- Where processes are already at a satisfactory or above satisfactory level.
This can be achieved by comparing KPIs (Key Performance Indicators) with other institutions. The KPIs can be measured on a monthly or yearly basis allowing for the identification of trends.
For example, an institution may see that from the time of ordering physical items until the time the items arrive takes significantly longer than the average for other institutions.
This institution can then drill down to investigate where in the process there may be a problem.
- It may be that between the time the order is created until the time it is sent takes too long because the “review” process is taking too long.
- It may be that certain vendors are taking an unusually long time to process the orders.
- There could also be a problem with the period from when the item arrives to the institution until it arrives to the acquisitions librarian to scan it in.
Benchmark analytics allows the institution to identify these issues.
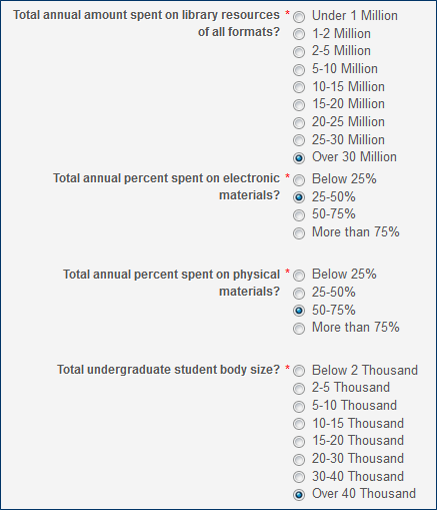
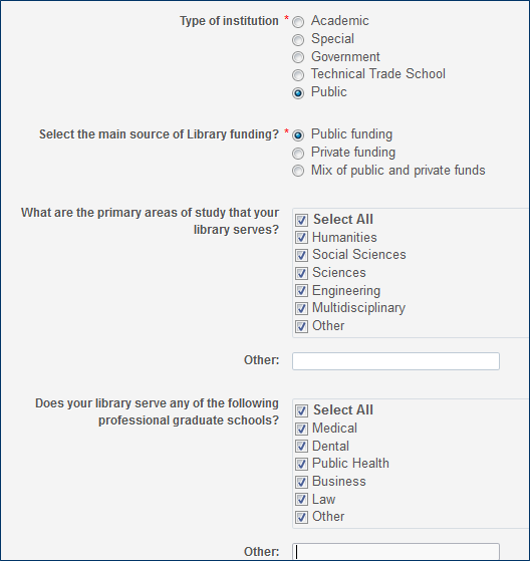
As part of the process each institution is defined with a profile so that they can be compared appropriately with other institutions:
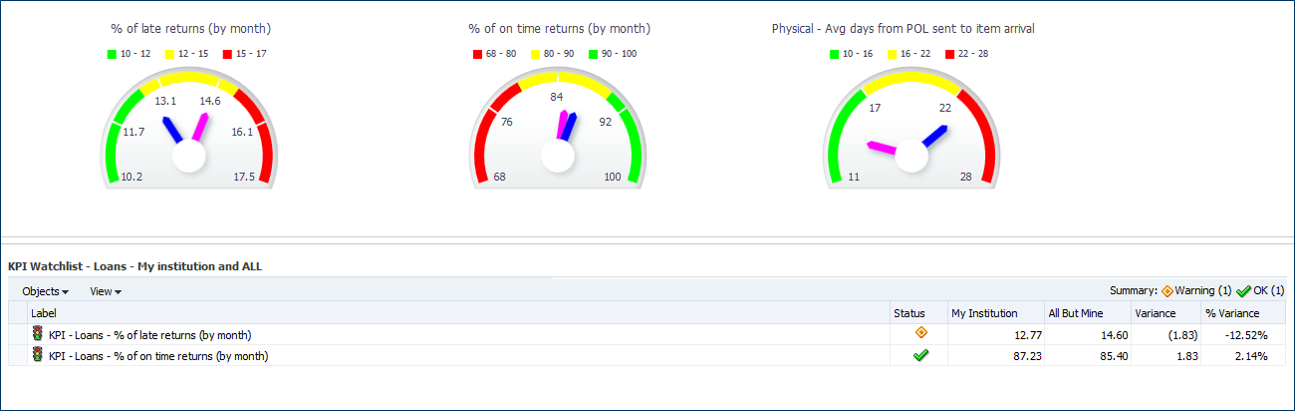
Benchmark analytics can be easily accessed via an “out of the box” customizable and ready to use KPI dashboard.
The KPI Watchlist provides a summary of various KPIs which can be seen together.
The gages inform the user where his institution (blue dial) stands in comparison to other institutions (pink dial):
The “My Trends” tab of the dashboard provides the institution with an up close look at his own institution, and may be filtered by time and other measures.
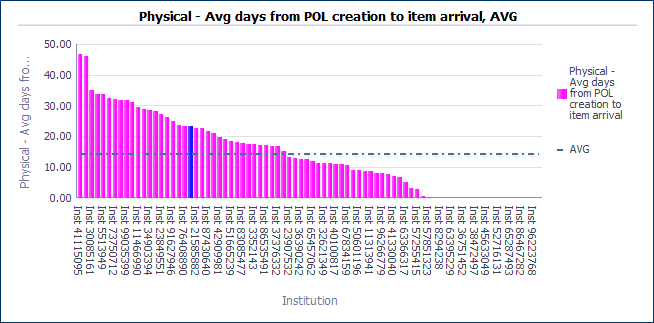
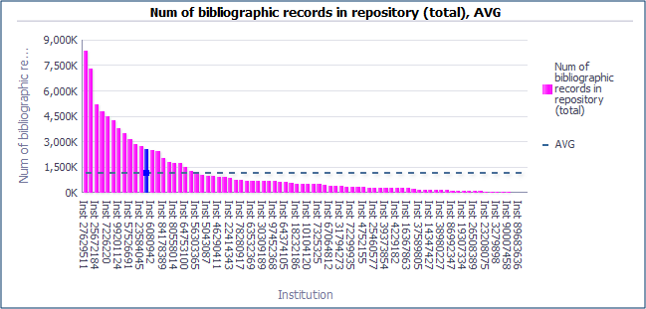
The Inventory Total tab allows the institution to compare its inventory to other institutions:
- The dotted line is the average
- The blue bar is “my institution”
- The pink bars are all other institutions.
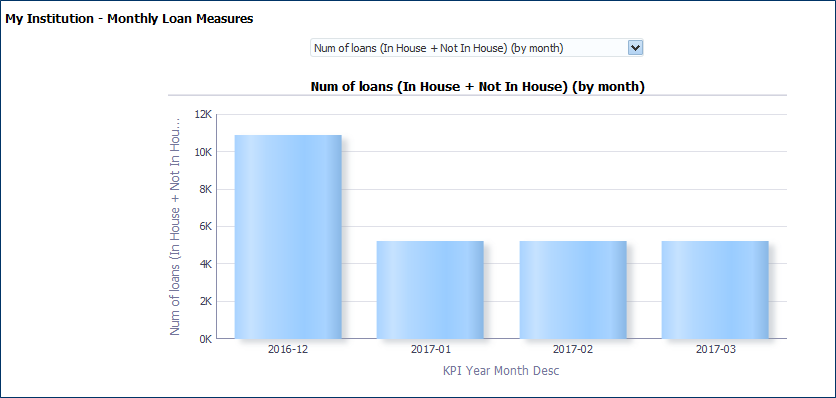
The Loans by Month tab allows the institution to compare its fulfillment loans with other institutions:

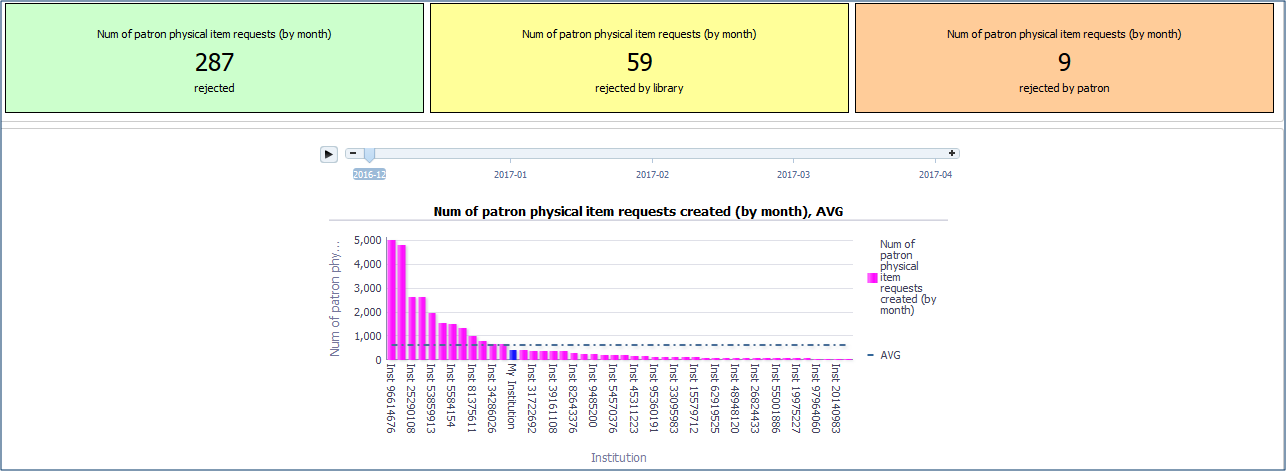
The Requests by Month tab allows the institution to compare its fulfillment requests with other institutions:
The Acquisitions – Electronic tab allows the institution to compare its acquisitions measures regarding electronic collection and portfolios with other institutions.
The Acquisitions – Physical tab allows the institution to compare its acquisitions measures regarding the ordering of physical one-time inventory with other institutions.
As an example, in the following image, the institution can see that the time it takes from ordering physical inventory to having it arrive it is much slower than the average: