
Using Primo VE Analytics
This section describes the general activities that you can perform with Primo Analytics, such as the following:
-
Navigating Primo Analytics
-
Running out-of-the-box reports
-
Creating reports
-
Adding graphs to reports.
Navigating Primo Analytics
This section describes how to access Primo Analytics and navigate among its various capabilities.
Global Header
You can use the Global Header (which appears at the top of each page) to navigate between components in the Primo Analytics interface.
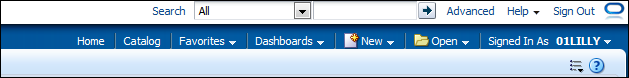
Global Header
The global header includes the following components:
-
Search – Enables you to search the Catalog, which includes all the objects (such as reports, dashboards, and more) created in OAS (Oracle Analytics Server).
-
Advanced – Displays the Catalog page in search mode where you can search for objects in the catalog. In search mode, the Search pane is displayed rather than the Folders pane within the page.
-
Help – Provides different help options relevant for Oracle BI and not specifically for Primo Analytics. It includes the following options:
-
<page> Help (where <page> is the name of the page, editor, or tab) – Dynamically changes to display the Help topic for the current page, editor, or tab.
-
Help Contents – Displays a cascading menu that provides options that link to the tables of contents for Oracle BI EE
-
Documentation – Displays the documentation library for Oracle BI EE
-
OTN – Displays the Business Intelligence and Data Warehousing Technology Center page on the Oracle Technology Network (OTN)
-
About Oracle BI EE – Displays a dialog identifying the Oracle BI EE version and copyright information
-
-
Sign Out – Signs you out of Primo Analytics
-
Home – Displays the Home page
-
Catalog – The location where all reports are saved, including personal and shared reports. For more information, see Catalog.
-
Dashboard – A shortcut to all available dashboards that are saved in the dedicated dashboard subfolders.
-
New – Displays a list of the OAS objects that can be created. This document describes the Analysis option (which creates new reports) and the Dashboard option (which creates dashboards). For more details on creating new reports, see Creating New Reports.
-
Open – Displays the following options:
-
Recent – Displays a list of the objects that you have recently viewed, created, or updated.
-
Most Popular Objects – Displays a list of the objects that are accessed the most often.
-
-
Signed In As username – Displays the username of the currently signed-in staff user.
-
My Account – Displays the My Account page, which enables you to specify your preferences such as the time zone, delivery devices, and delivery profile.
The following figure shows some of the commonly used object icons in the Primo Analytics interface.
Analytics Icons
Catalog
The Catalog arranges reports and dashboards (grouping of reports) into folders. In addition to reports and dashboards, it is also possible to store report prompts as standalone objects.
The Primo Analytics Catalog has the following folders, which display in the folder’s pane:
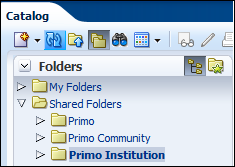
Types of Analytics Folders
-
My Folders – Stores your personal reports and dashboard in subfolders. The content in this folder is not shared with others in your institution or the Primo community.
-
Shared Folders – Stores reports, prompts, and dashboards that can be shared at various levels in subfolders. The Shared Folders folder has the following subfolders:
-
Primo – Contains the out-of-the-box reports and dashboards created by Ex Libris. These reports cannot be modified directly, but you can copy them to My Folder and change them. The Primo folder contains the following subfolders:
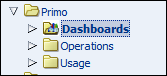 Primo Subfolders
Primo Subfolders Subfolder Description DashboardsThis subfolder contains the following dashboards:-
Example Dashboard – This dashboard contains a tab for each Primo subject area.
-
Trends – This dashboard focuses on searches and usage.
OperationsThis folder contains operation-related reports, dashboards, and prompts for Pipes and PNX records.
These types of reports, dashboards, and prompts are not applicable to Primo VE.
UsageThis subfolder contains usage-related reports, dashboards, and prompts. -
-
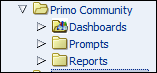
Primo Community – This folder contains reports and dashboards that are created by the entire Primo community. Reports placed in this folder can be viewed and edited by all Primo customers who have access to the OAS. The reports are shared across all regions using a scheduled synchronization that runs every week on Friday. You can copy these reports to your folders to make local modifications.The Primo Community folder has the following out-of-the-box subfolders: Dashboard, Prompts, and Reports.
 Primo Community SubfoldersThe Reports subfolder has a separate subfolder for each subject area, which is described in separate sections below. When adding reports to the Primo Community folder, make sure that you add reports to the appropriate folder and prefix the name of the reports with your institution name and a dash so that each report is identifiable by the contributing institution. For example:
-
U. Minn - Search Related Actions
-
U. Sienna - Sessions and Sign-in
Reports that are contributed by Ex Libris are prefixed with Ex Libris –.Each institution can browse the folders for reports pertaining to a specific area or perform a search for reports from a specific institution.Libraries are encouraged to add information in the properties of the reports so that other libraries can identify the functionality of the report easily. For example: Popular Searches Example
 -
-
Primo Institution – Every Primo institution has its own folder. Out-of-the-box, subfolders are provided for dashboards, prompts, and reports. Objects placed in this folder are only viewable to users who belong to the institution.
-
Home
Select the Home link to display the Primo Analytics home page:
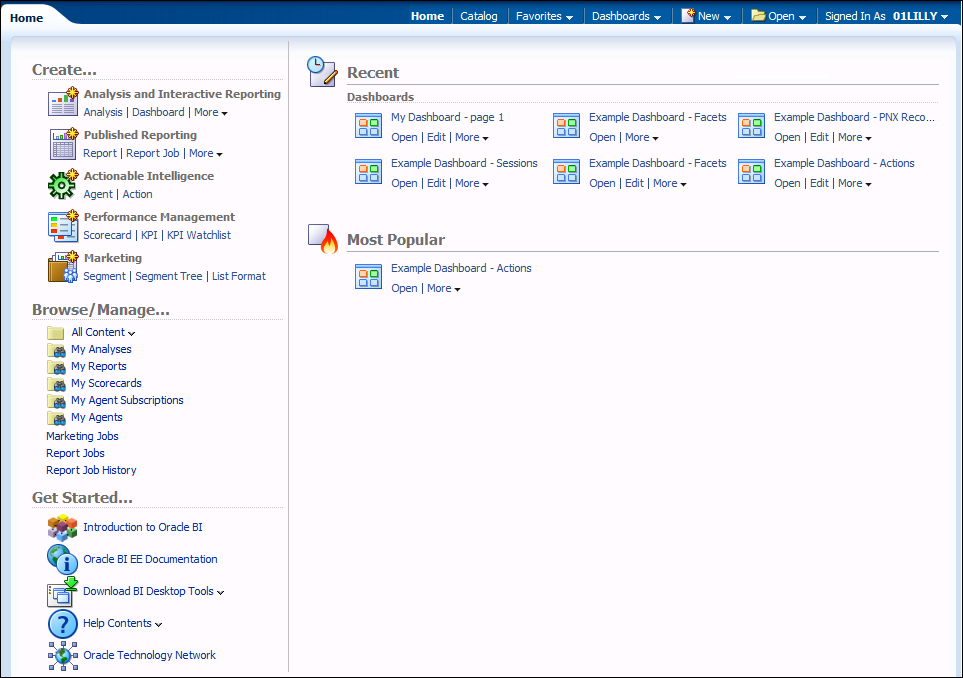
Primo Analytics Home Page
The Home page is a task-oriented, centralized workspace that is combined with a global header that provides access to Primo Analytics objects, their respective editors, help documentation, and other features.
Running the Out-of-the-Box Reports
You can run reports whose criteria have been created by Ex Libris.
To run an out-of-the-box report:
-
Select Catalog and then select the Primo folder under Shared Folders.
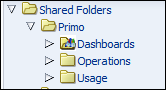 Shared Folders
 -
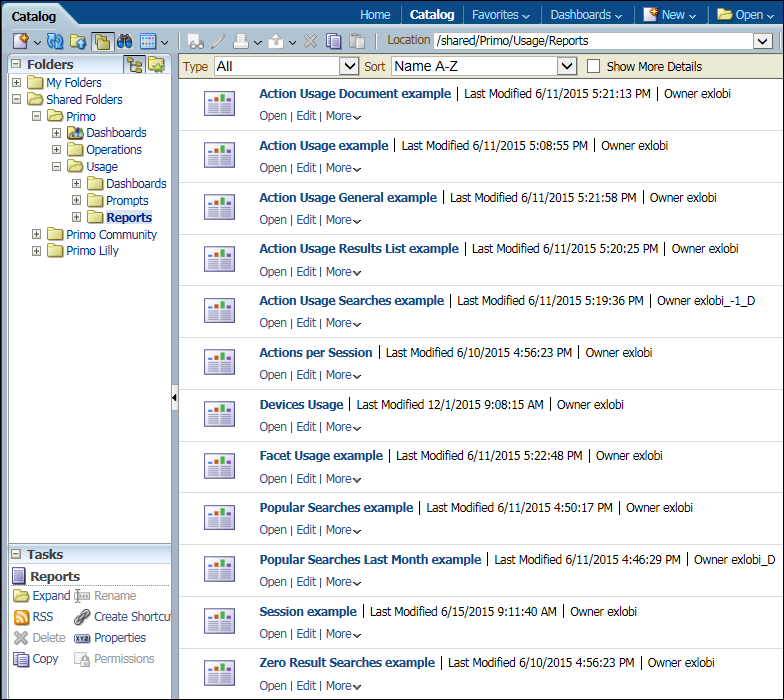
Select the expand buttons next to Shared folders > Primo > Usage > Reports — for example, the out-of-the-box reports that are related to Usage display:
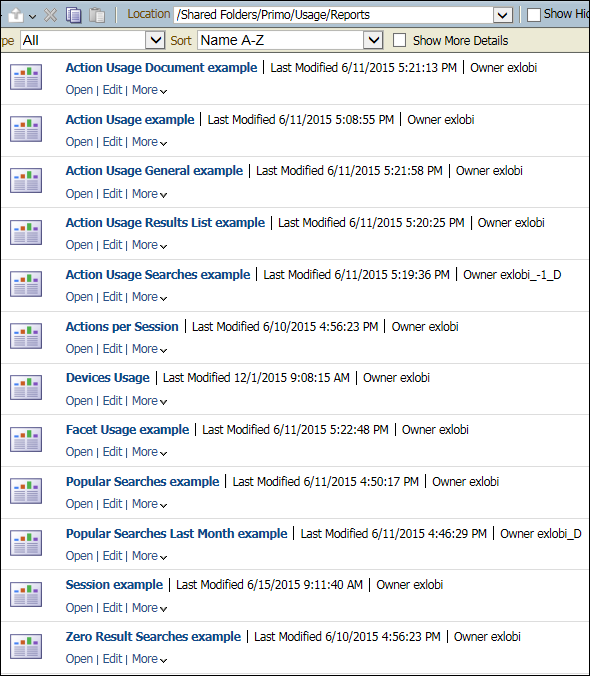 Usage Reports
 -
Select Open for the report that you want to run.
Displaying Dashboards
Dashboards provide an at-a-glance view of one or more reports. These dashboards may be provided by Ex Libris, the community, or yourself. You can display these dashboards from either the Catalog or the Dashboard drop-down list in the Global Header.
To display an out-of-the-box dashboard from the Catalog:
-
Select Catalog and then select the Primo folder under the Shared Folders.
-
Select the expand buttons next to Shared folders > Primo > Dashboards
-
Select Open for the dashboard you want to display.
To display a dashboard from the Community:
-
Select Catalog and then select the Primo Community folder under the Shared Folders.
-
Select the expand buttons next to Shared folders > Primo Community > Dashboards
-
Select Open for the dashboard you want to display.
To display your personal dashboard:
Select Catalog > My Dashboard.
To display a dashboard from the Global Header:
-
Select Dashboards in the Global Header:
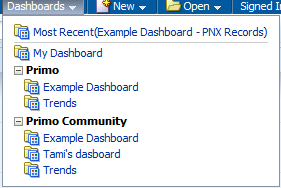 Dashboards
 -
Select the dashboard that you want to view under Primo or Primo Community. If you want to see your personal dashboard, select My Dashboard.
Copying Reports
The copy function enables you to customize a report to create another report. This is useful if the original report includes similar information.
To copy a report:
-
Open the catalog and locate the report that you want to copy.
-
Select More > Copy.
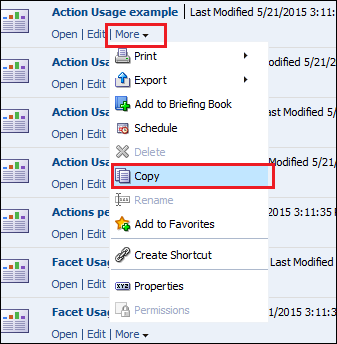 Selecting a Report to Copy
 -
Navigate to the target folder of the report and select Tasks > Paste.
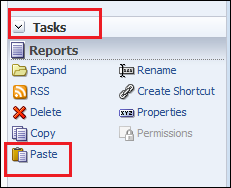 Pasting the Report in the Target Folder
Creating New Reports
You can create new reports to provide you with information on library activities. The simplest way to create a report is based on one subject area. There are cases in which you need to combine data from more than two subject areas. (For more information on creating a report from two subject areas, see Creating Advanced Reports).
Analytic reports can have a maximum of one million cells and up to 65,000 lines.
Reports in Primo Analytics can be based on data that is organized by subject areas that include two broad categories:
-
Usage – Subject areas that are related to usage of the Primo Front End:
-
Primo Action – Provides information on end-user use of the various Primo functionality.
-
Primo Facets – Provides information on facet usage.
-
Primo Popular Searches – Lists the details for the most popular searches.
-
Primo Sessions – Provides information on Primo sessions.
-
Primo Zero Result Searches – Lists the details for searches that found no results.
-
-
Operations – These types of reports are not applicable to Primo VE. Subject areas that are related to Primo Back Office processes and Primo’s database:
-
Primo Pipes – Provides details on Primo pipes processing.
-
Primo PNX Records – Provides information on PNX records.
-
Creating Basic Reports
The following procedure is a basic example of how to create a report:
To create a report:
-
Select New > Analysis. The Select Subject Area menu opens.
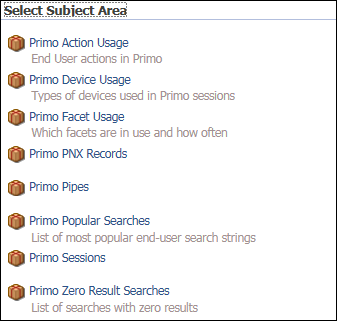 Select Subject Area Descriptions Menu
 -
From the Select Subject Area menu, select Primo Action Usage — for example, to open the Analysis Editor.
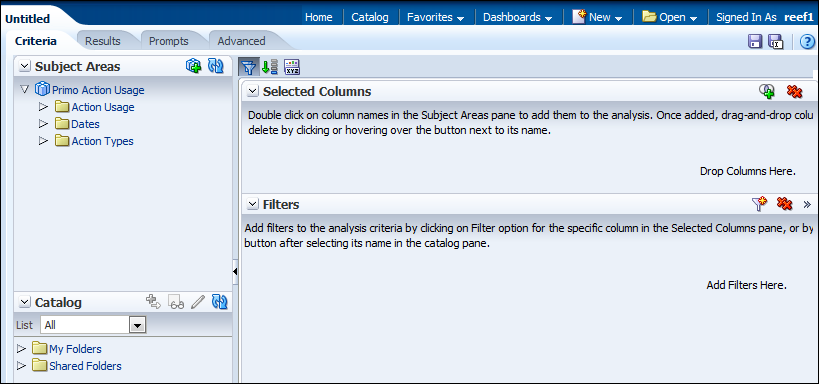 Analysis EditorThe Analysis Editor contains the following components:
-
The left pane displays the elements of the Primo Actions Usage subject area:
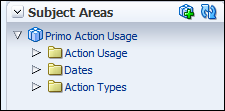 Primo Action Usage Area
 -
The Analysis Editor contains the following tabs. Their use is described in later sections:
-
Criteria – Used to create the report columns and filters.
-
Results – Used to display the report with data relevant to your institution.
-
Prompts – Used to add report prompts.
-
Advanced – This tab is not described in this document and requires expert knowledge of OAS.
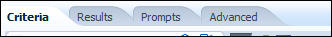 Analysis Editor Tabs
 -
-
-
To create a report of the number of times a certain action was invoked, perform the following steps:
-
Select the arrow next to the Actions Type to expand the Actions Type dimension folder. Double-click the Action Group, Action Sub Group, and Action fields (or drag and drop them into the Selected Columns pane).
-
Select the arrow next to the Action Usage folder and then double-click the Actions measure. The selected columns should look similar to the following example.
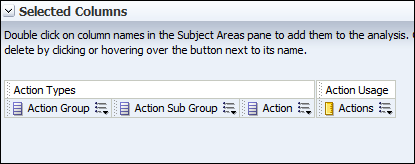 Selected ColumnsYou can reorder the columns in your report by selecting and dragging them to the new position.
 -
Select the Results tab to see the report’s results.
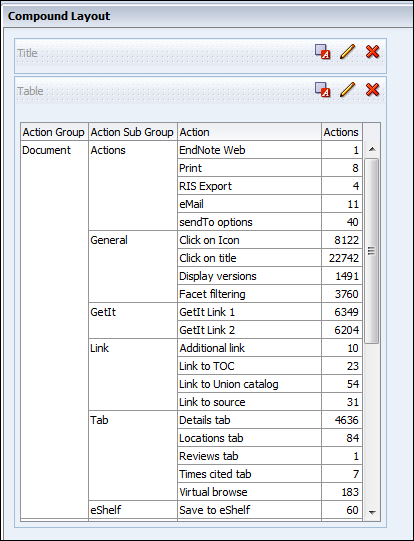 Results
-
Creating Advanced Reports
You may want to include information in a report from two subject areas. To create reports from two subject areas, the following conditions must be met:
-
There must be at least one common dimension between the two subject areas.
-
Descriptive fields must come from common dimensions.
Measurement fields can come from the facts, although they are not common dimensions.
If you attempt to create a report from two descriptive fields that are not in common between the two subject areas, an error message appears.
In this example, we create a report from the Actions Usage and Sessions to create a report for the average number of actions per session.
To create a report from two subject areas:
-
Select New > Analysis. The Select Subject Area menu opens.Select Subject Area Descriptions Menu
-
In the Select Subject Area menu, select Primo Action Usage — for example, to open the Analysis Editor.Analysis Editor
-
In the left pane, select the Add/Remove Subject Areas icon
 and select Sessions. Both the Action Usage and Sessions subject areas appear:
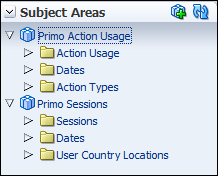 Action Usage and Session Subject Areas
 -
The Action Usage and Sessions subject areas have the Dates dimension in common. Add any date to the report as well as any measurement dimensions. For example, select Sessions from the Sessions column and Actions from the Action Usage column.
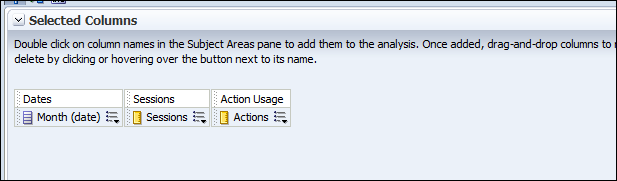 Report Criteria from Two Subject Areas
 -
Add a column that calculates the average number of actions per session:
-
Select the Criteria tab and add a new column of any kind — for example, Signed-In.
-
Select the More Options icon
 of the new column and select Edit Formula. The Edit Column Formula dialog box opens:
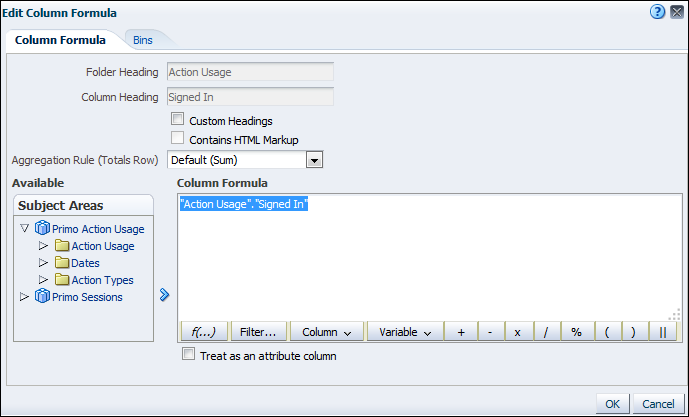 Edit Column Formula Dialog Box
-
-
Highlight and replace the existing formula with the following formula, and then select OK:1.0*"Action Usage"."Actions"/"Primo Sessions"."Sessions"."Sessions"
-
Select the More Options icon
 of the new column and select Column Properties > Column Format.
 -
Select the Custom Headings checkbox.
-
Enter a new name for the column in the Column Heading field.
-
Select OK.
-
Select the More Options icon
 of the new column and select the Data Format tab:
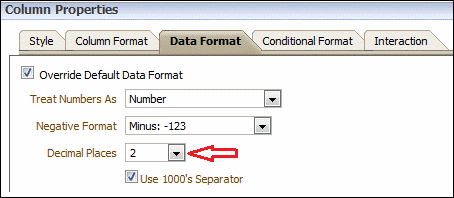 Column Properties Dialog Box
 -
Select the Override Default Data Format checkbox.
-
Select 2 from the Decimal Places drop-down list.
-
Select the Results tab to display the report.
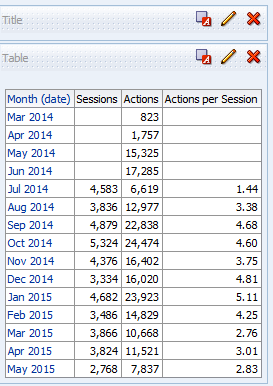 Analytics Report
Filtering a Report
Filters enable you to limit the amount of data displayed in the report and are applied before the report is aggregated. Filters affect the report and, thus, the resulting values for measures. Filters can be applied directly to attribute columns and measure columns.
To filter a report:
-
Select the More Options icon
 next to the column whose data you want to filter and select Filter. Alternatively, select the Filter icon
  and select the appropriate column from the drop-down list.The New filter dialog Box opens — for example, for the Action Group:
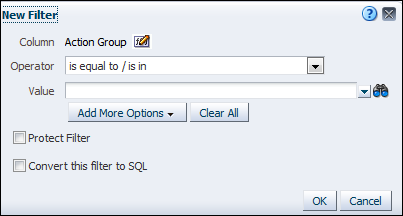 New Filter - Action Group
 -
Select an option from the Operator drop-down list.
-
Enter a value in the Value field.The filter appears at the bottom of the Filter pane.
-
Select the Results tab to display the results filtered according to the criteria you set.
Sorting a Report
You can sort the data in a column — for example, to be ascending or descending.
To sort a column:
-
Select the More Options icon
 next to the column whose data you want to sort and then select Sort.
 -
Select a sort option to sort the column.
Saving a Report
After you create a report, you can save a private or public version by placing it under the appropriate area:
-
My Folders – Area reserved for private reports.
-
Shared Folders – Area reserved for shared reports. Place all shared reports in the appropriate folder under Primo Community. Remember to prefix the report with your institution name and include a description of the report.
To save a report:
-
Select the Save icon
 to open the Save As dialog box.
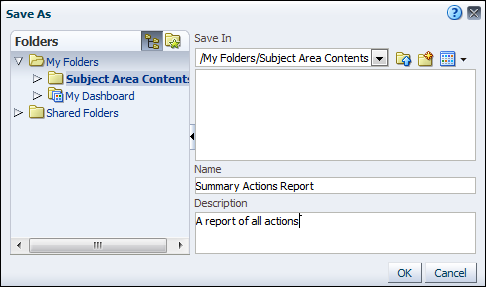 Save As Dialog Box
 -
Select a folder under either the My Folders area (for private usage) or the Shared Folders area (for shared usage).
-
Specify a name and a description for the new report in the corresponding fields.
-
Select OK.The title appears at the top of the report. To change the title:
-
Select the Results tab.
-
Select the Edit icon
 in theViews pane.
 -
Enter a new title in the Title field.
-
Adding Totals to a Report
You can display the total of a column of a report.
To display a column’s total:
-
Select the Edit icon
 of the report in the Results tab. The Table Editor opens:
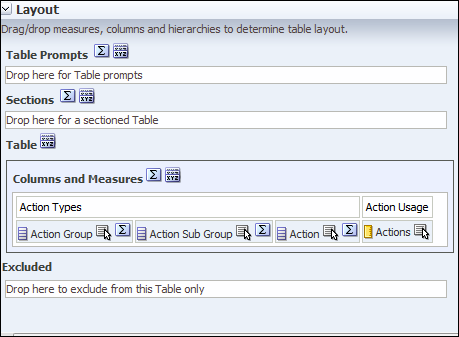 Table Editor
 -
Select the Totals icon
 in the Columns and Measures section and then select After. The green check mark indicates that a grand total has been added to the analysis.
 -
Select Done to display a grand total.
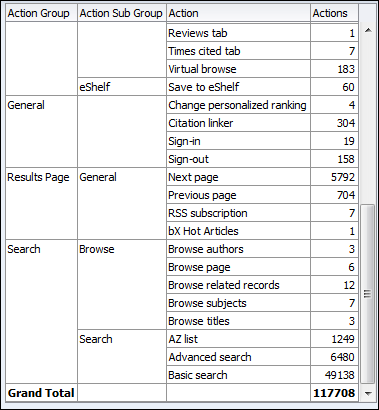 Grand Total Example
Formatting a Report
You can format a report.
To format a report:
-
On the Results tab of a report, select the edit icon
 . For example, the following page opens:
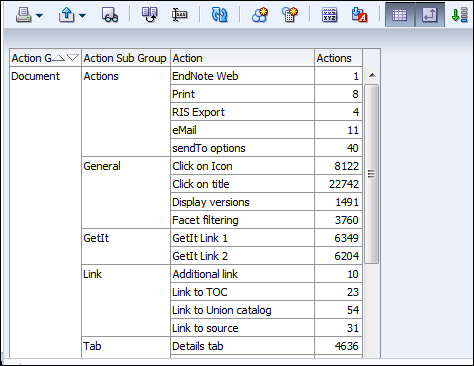 Example Results for a Report
 -
On the top of the toolbar, select the Table View Properties icon
 . The table properties dialog box opens:
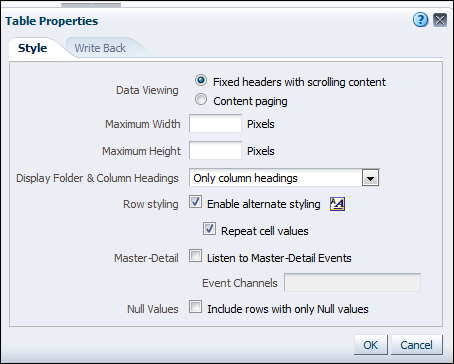 Table Properties
 -
On the Style tab, select Enable alternate row styling.
-
Select Repeat cell values to display each full row in the table in a separate color.
-
Select Set alternate format. The following is displayed:
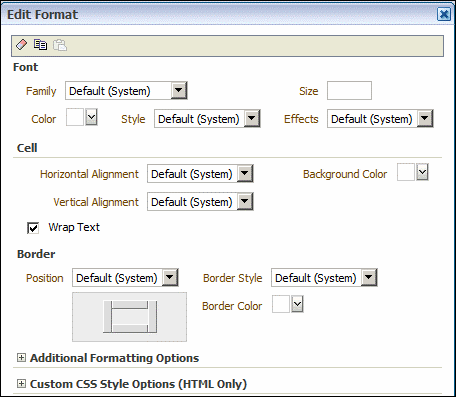 Edit Format Dialog Box
 -
Select the formatting options you want — for example, from the Background Color drop-down list, select yellow for the background color.
-
Select OK.The table is now formatted with alternating yellow rows:
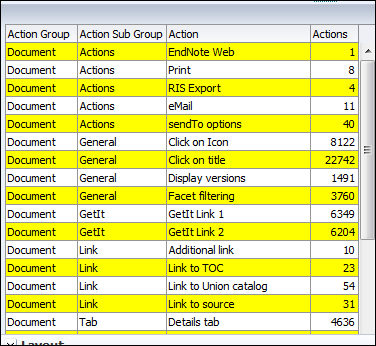 Rows Alternating Colors
Adding a Graph to a Report
You can add a graph, such as a pie chart, to the report.
To add a graph to a report:
-
On the Results tab, select the New View icon
 and select Graph > Pie.
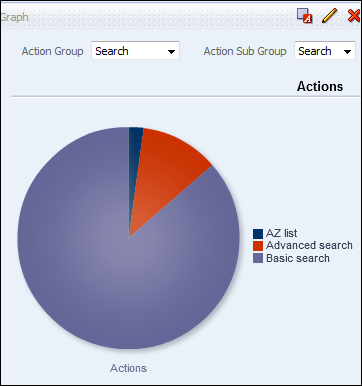 Pie Chart
 -
If you want only the pie chart, select the Remove View from Compound Layout icon
 for both Title and Table views. Both views are removed to display the graph only.The Title and Table views are still available for use from the Views pane.
Formatting a Graph
You can format a graph. The formatting options available are different depending on the type of graph you are formatting. In this example, we format a pie graph.
To format a graph:
-
On the Results tab, select the Edit View icon
 to open the Graph Editor.
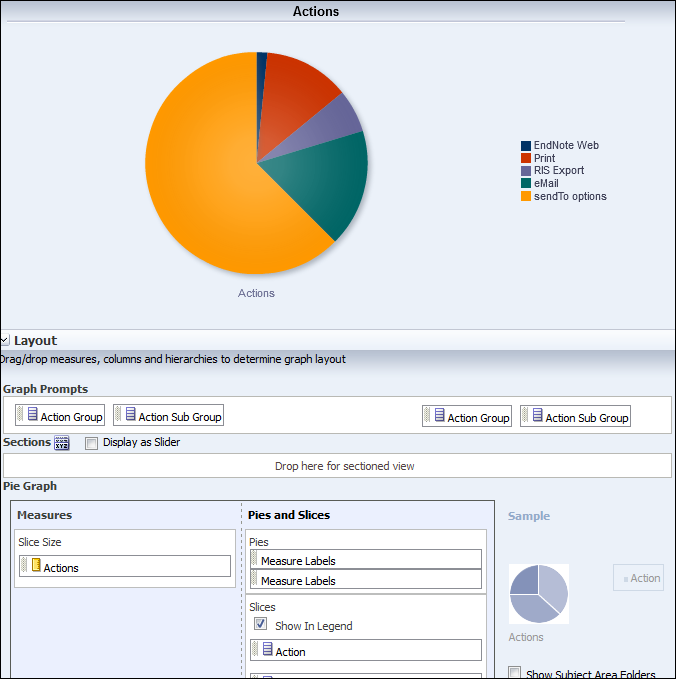 Graph Editor
 -
Select the Edit Graph Properties icon
 on the top toolbar to open the Graph Properties dialog box.
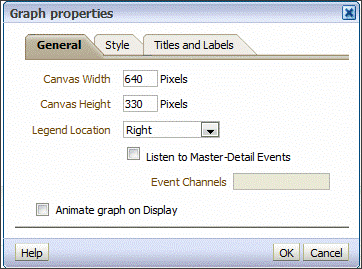 Graph Properties Dialog Box
 -
You can change various graph properties from the General, Style, and Titles and Labels tabs. For example, perform the following steps:
-
On the General tab, select Left from the Legend Location drop-down list.
-
On the Style tab, make the following changes:
-
In the Legend section, select gray as the background color and blue as the border color.
-
In the Canvas Colors and Borders section, select turquoise for the background color and blue for the background color.
-
Clear the Gradient checkbox.
-
-
On the Titles and Labels tab, make the following changes:
-
Clear the Use measure name as graph title checkbox and enter a title (such as Primo Actions Drop-Down Chart).
-
In the Labels section, select the Format Title icon
 next to legend, select Arial from the Family drop-down list, enter 10 in the Size field, and select the color.
-
-
Select OK to open the modified graph.
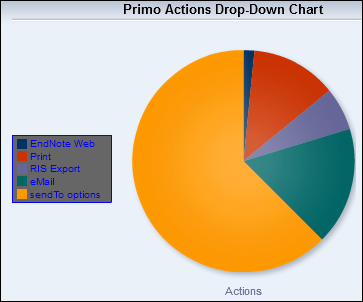 Customized Pie Chart
-
Creating a Dashboard
This section describes how to create a new dashboard.
To create a new dashboard:
-
Select New > Dashboard to open the New Dashboard dialog box:
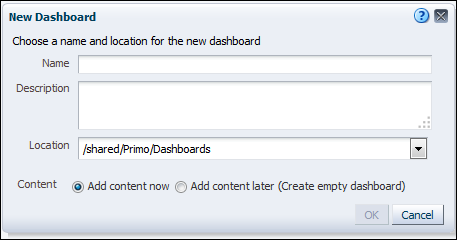 New Dashboard Dialog Box
 -
Enter the following information:
-
Name – Enter a name for the dashboard.
-
Description – Enter a description for the dashboard.
-
Location – Enter the location where you want the dashboard to be saved.
-
Content – If you want to add content now, select Add content now, which is the default option. If you want to add content later and create an empty dashboard, select Add content later (Create empty dashboard).
-
-
Select OK.
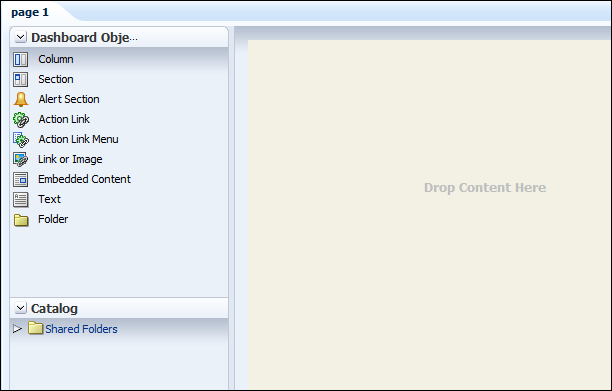 Selecting Reports for Dashboards
 -
If you want to create a dashboard with reports from your local institution folder, drag and drop reports from your institution’s folder in the Catalog pane to the drag-and-drop area in the right pane.
-
If you want to use an out-of-the-box report in a dashboard, you must first copy it to your local institution:
-
Select Catalog to open the list of folders:
 List of Folders in Catalog
 -
Select More > Copy for the report that you want to copy to your local institution folder.
-
Navigate to your local institution folder and select More > Paste to paste the out-of-the-box report to your local folder.You can now configure the dashboard to be displayed.
-