
Mixpanel Reports
Introduction
A report is the basic unit for performing an analysis in Mixpanel. It can be saved to a board, which can contain many reports.
Each report is made up of at least one metric and is displayed using the chosen visualization. A report can have one of the following types: Insights, Funnels, Flows, or Retention.
Insights Report
Insights is a tool designed to visualize trends and compositions within your data. You can analyze events, cohorts, and user profiles, and display the data in a wide variety of chart types. An Insights report may be used for various types of cases, such as the following:
-
How is my WAU (weekly active users) changing over time? (unique users)
-
How often are my users getting value > click an online resource link
-
What is the distribution of my users across user type/devices, etc? (Property breakdown)
-
Which facet is the most used?
-
How many users are logged in vs. guests?
-
Where are users coming from?

-
Select Create New > Insights to open the report editor with the Insights Query tab automatically selected. For more information, see Mixpanel's Insights.
 Create an Insights Report
 -
Select Untitled and enter a title for the report.
 Add a Title for the Report
 -
Add Events to track in your report:
-
Select Metrics and choose an Event. To add more than one Event, select Metrics again.
 Select Event (Online Resource Link Highlighted)
 -
Select a count type for each Event: Unique Users, Total Events, Total Sessions, Frequency per User, Aggregate Property, or Aggregate Property per User.
 Choose Count Type (Unique Users)
-
-
(Optional) Filter Results based on Properties:
-
Select Filter and choose a Property. To add more than one Property, select Filter again.
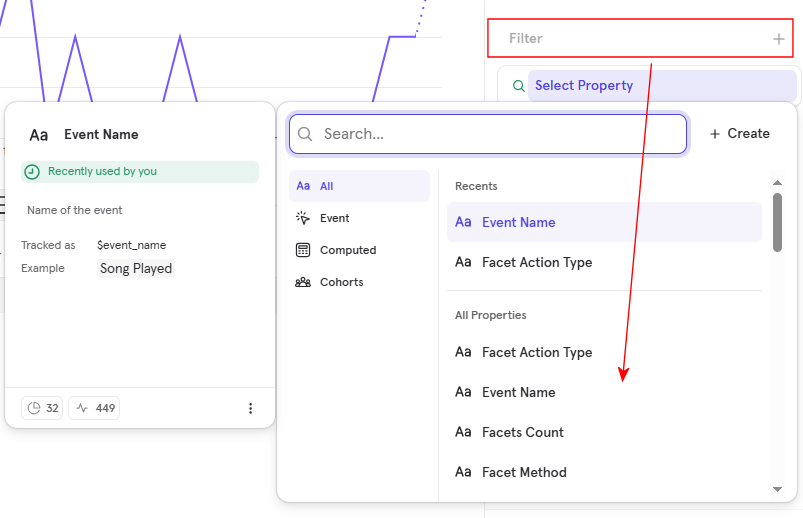 Select a Filter (Event Name)
 -
Select values to filter for a Property, and select Add.
 Add Values to Filter for a Property
-
-
(Optional) To highlight usage based on specific properties, select Breakdown and choose a Property. To add more than one Property, select Breakdown again.
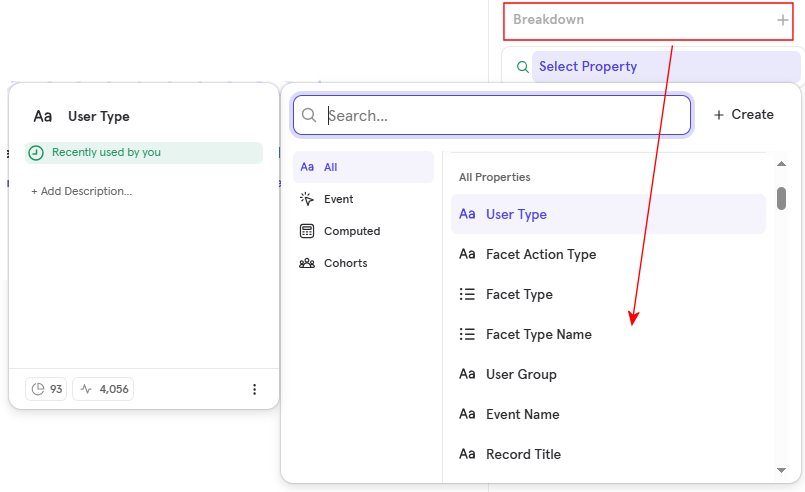 Break Down the Results by Property
 -
Select the report's type of visualization: Line, Stacked Line, Bar, Stacked Bar, Pie, Table, or Metric.
 Select the Type of Visualization for the Report
 -
Select Save to save the report to an existing Board or a new Board.
Funnels Report
Funnels allow you to examine how end-users perform events in a series. Funnels calculate and display the number of users who convert from one event to another within a particular time window. This allows you to identify where your users drop off, what segments convert the most, and other important facets of the user journey.
A Funnels report may be used for various types of cases, such as the following:
-
At what step of certain events did most users drop off?
-
How long does it take most users to complete a certain event?

-
Select Create New > Funnels to open the report editor with the Funnels Query tab automatically selected. For more information, see Mixpanel's Funnels.
 Create a Funnels Report
 -
Select Untitled and enter a title for the report.
Add a Title for the Report -
Add at least two steps to track in your report:
-
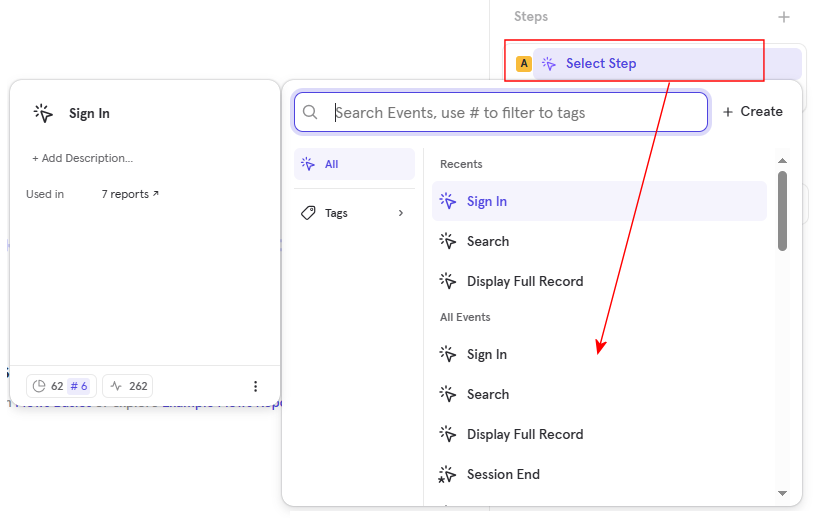
Select the first Select Step row and choose an Event.
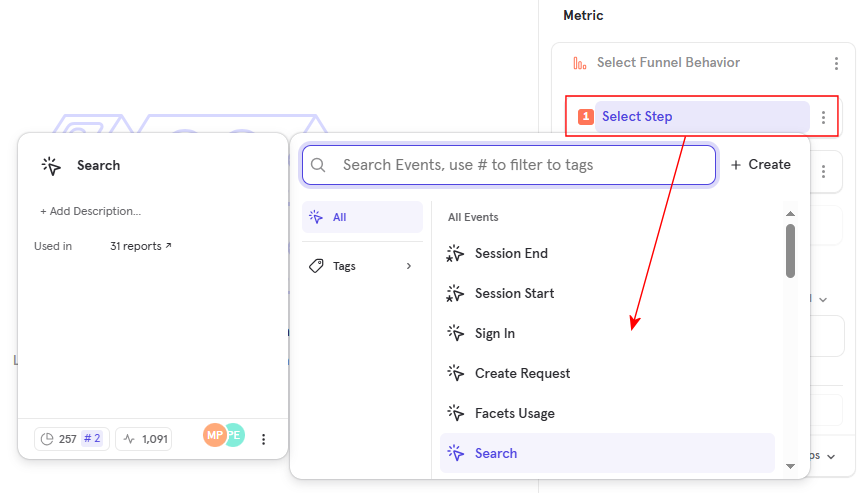 Select the Event for Step 1
 -
Select the second Select Step row and choose an Event.
 Select the Event for Step 2
 -
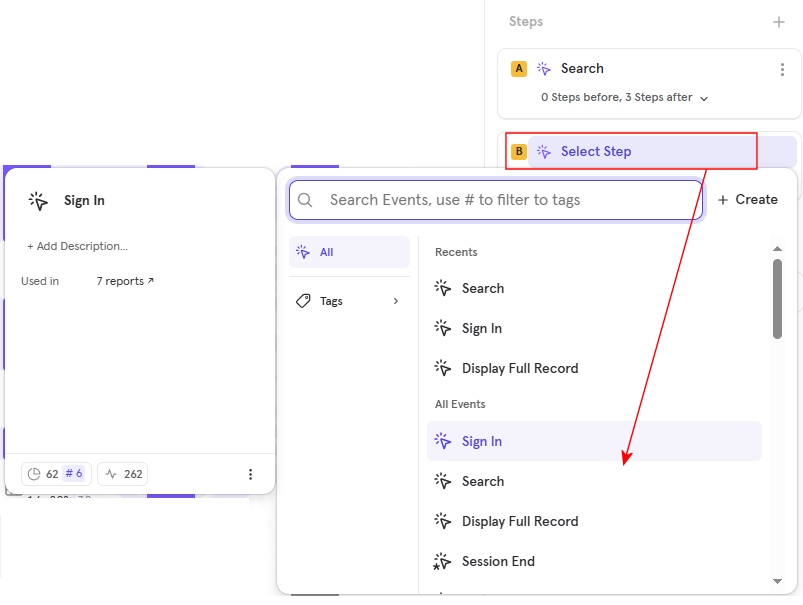
(Optional) To add more steps to your Funnel report, select the unnumbered Select Step row and choose an Event.
 Select the Event for an Additional Step
-
-
Add the Conversion Window to track the Funnel's events. For more information, see Mixpanel's Funnels Advanced Concepts.
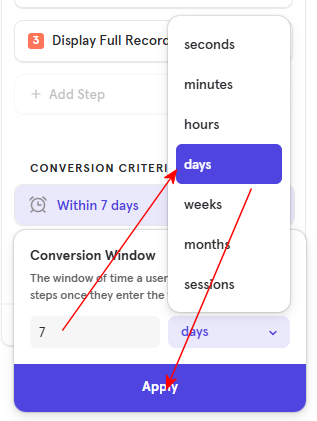 Add the Conversion Window
 -
Enter the Conversion Rate for all or specific steps.
 Add the Conversion Rate to the Steps
 -
(Optional) Filter Results based on Properties:
-
Select Filter and choose a Property. To add more than one Property, select Filter again.
Select a Filter (Event Name) -
Select values to filter for a Property, and select Add.
Add Values to a Filter for a Property
-
-
(Optional) To highlight usage based on specific properties, select Breakdown and choose a Property. To add more than one Property, select Breakdown again.
Break Down the Results by Property -
Select the report's type of visualization: Funnel Steps, Line, Bar, Metric, or Top Paths.
 Select the Type of Visualization for the Report
 -
Select Save to save the report to an existing Board or a new Board.
Flows Report
Flows identify the most frequent paths taken by users to or from any event. Flows can be used to understand how your users sequentially perform events in Primo and analyze drop-offs or unsuccessful behavior.
A Flows report may be used for various types of cases, such as the following:
-
How do users navigate?
-
What did users do immediately after signing in?
-
Where do users drop off?
-
What are the most common sets of actions taken after opening Primo?

-
Select Create New > Flows to open the report editor with the Funnels Query tab automatically selected. For more information, see Mixpanel's Flows.
 Create a Flows Report
 -
Select Untitled and enter a title for the report.
Add a Title for the Report -
Add at least one step to track in your report:
-
Select the Select Step row and choose an Event.
 Select the Event for Step 1
 -
Specify the number of steps to track before and after the Event.
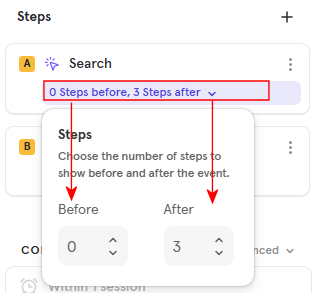 Add the Number of Steps before and after the Event
 -
(Optional) To add more steps to your Flows report, select the unnumbered Select Step row and choose an Event.
 Select the Event for an Additional Step
 -
(Optional) Specify the number of steps to track before and after the Event.
 Add the Number of Steps before and after the Event
-
-
Select the Counting Method for your Flows report: Uniques, Total, or Sessions. For more information, see Mixpanel's Flows.
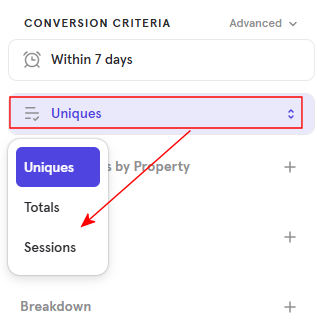 Select the Counting Method for the Report
 -
(Optional) Filter Results based on Properties:
-
Select Filter and choose a Property. To add more than one Property, select Filter again.
Select a Filter (Event Name) -
Select values to filter for a Property, and select Add.
Add Values to Filter for a Property
-
-
(Optional) To highlight usage based on specific properties, select Breakdown and choose a Property. To add more than one Property, select Breakdown again.
Break Down the Results by Property -
Select the report's type of visualization: User Flows or Top Paths.
Select the Type of Visualization for the Report -
Select Save to save the report to an existing Board or a new Board.
Retention Report
A Retention report assesses user engagement over a specified period and helps you understand how long users continue to return to Primo.
Usually, retention is tied to revenue. In the case of library discovery, we can tie retention to usage and get repetitive value from discovery. So, the main question is: What does it mean to be a retained user?
A Retention report may be used for various types of cases, such as the following:
-
On average, how many users are still active after X time from signing up?
-
What percent of all users are still doing valuable actions after a specific period?

-
Select Create New > Retention to open the report editor with the Retention Query tab automatically selected. For more information, see Mixpanel's Retention.
 Create a Funnels Report
 -
Select Untitled and enter a title for the report.
Add Title for Report -
Add two events to track in your report:
-
Select the first Select Event row and choose an Event.
 Select Event for Step 1
 -
Select the second Select Event row and choose an Event.
 Select Event for Step 2
-
-
Enter the Retention Duration for the report: Day, Week, Month, or Custom. For more information, see Mixpanel's Retention.
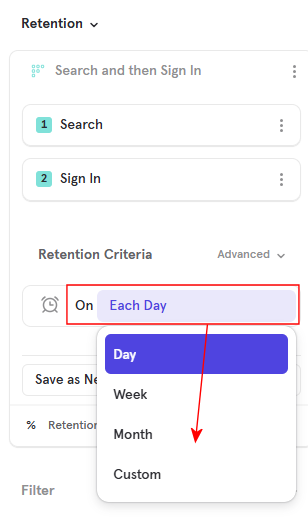 Add Retention Duration
 -
Enter the Retention Measurement for the report: Retention Rate, Unique Users, Property Sum, or Property Average.
 Add Retention Measurement
 -
(Optional) Filter Results based on Properties:
-
Select Filter and choose a Property. To add more than one Property, select Filter again.
Select a Filter (Event Name) -
Select values to filter for a Property, and select Add.
Add Values to Filter for a Property
-
-
(Optional) To highlight usage based on specific properties, select Breakdown and choose a Property. To add more than one Property, select Breakdown again.
Breakdown Results by Property -
Select the report's type of visualization: Retention Curve, Line, or Metric.
 Select the Type of Visualization for the Report
 -
Select Save to save the report to an existing Board or a new Board.