Roadmap Theme Analytics
![]() Analytics transforms a broad range of library data into actionable reports and identifiable trends for data-driven decision-making.
Analytics transforms a broad range of library data into actionable reports and identifiable trends for data-driven decision-making.
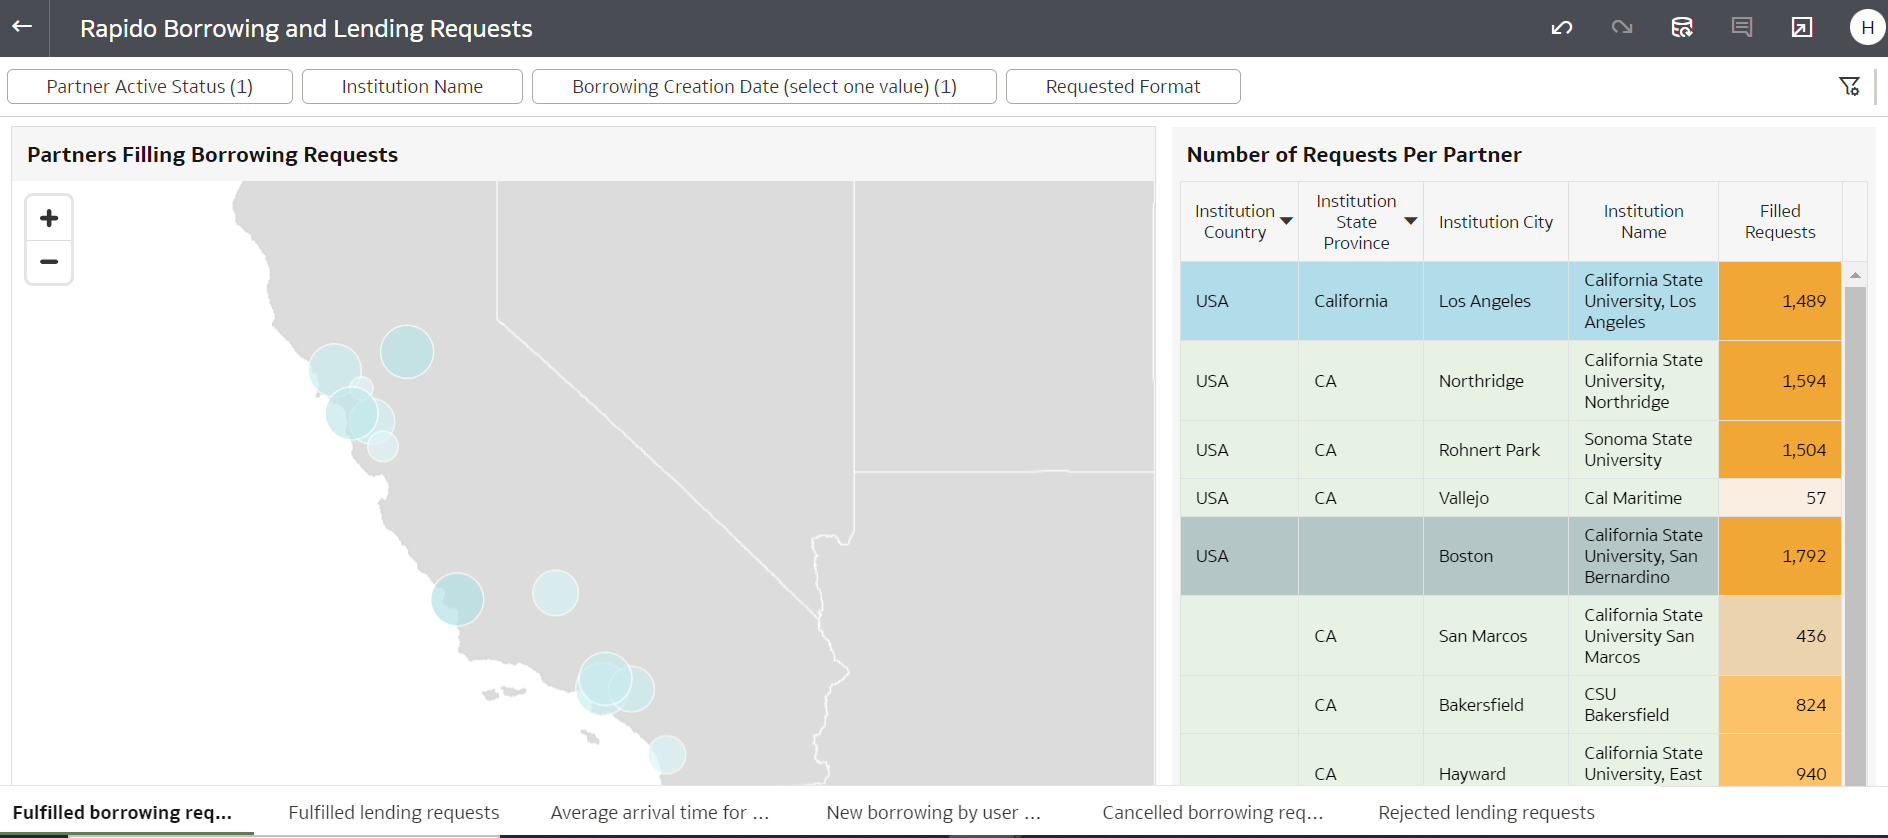
Rapido enables you to run analytics on your resource sharing activities in one system – sharing within consortia using Alma NZ, sharing beyond consortia, document delivery. Using the flexibility of the ExLibris analytics platform, you can create tailored reports on many different parameters to review and evaluate resource sharing borrowing and lending.
Create and access reports on fields within dimensions like request level measurements, partner level measurements, requester, Rapido specific attributes, library unit, bibliographic details. Using the flexibility of the ExLibris analytics platform enables creation of reports across shared dimensions to evaluate aspects of fulfillment, resource sharing, and acquisitions.
Lending Reports and Dashboards
Access out of the box reports and dashboards to review lending resource sharing filled and unfilled percentages, request activity between partners, reject reasons, most requested titles, yearly trends and more.
Customize these reports and dashboards to further personalize and refine your analytics experience.
Borrowing Reports and Dashboards
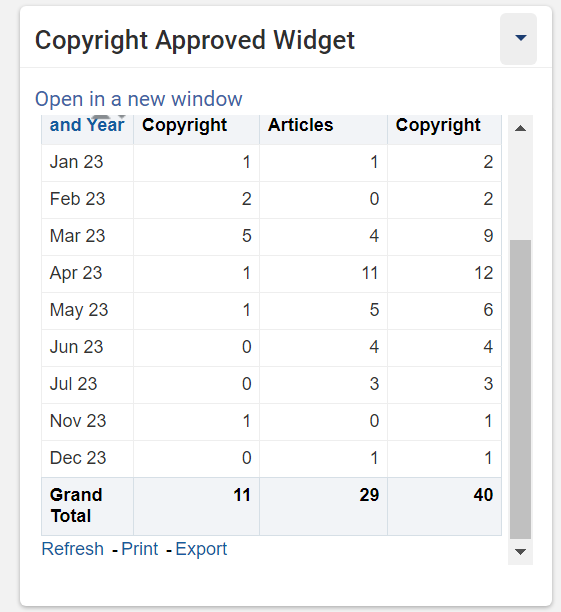
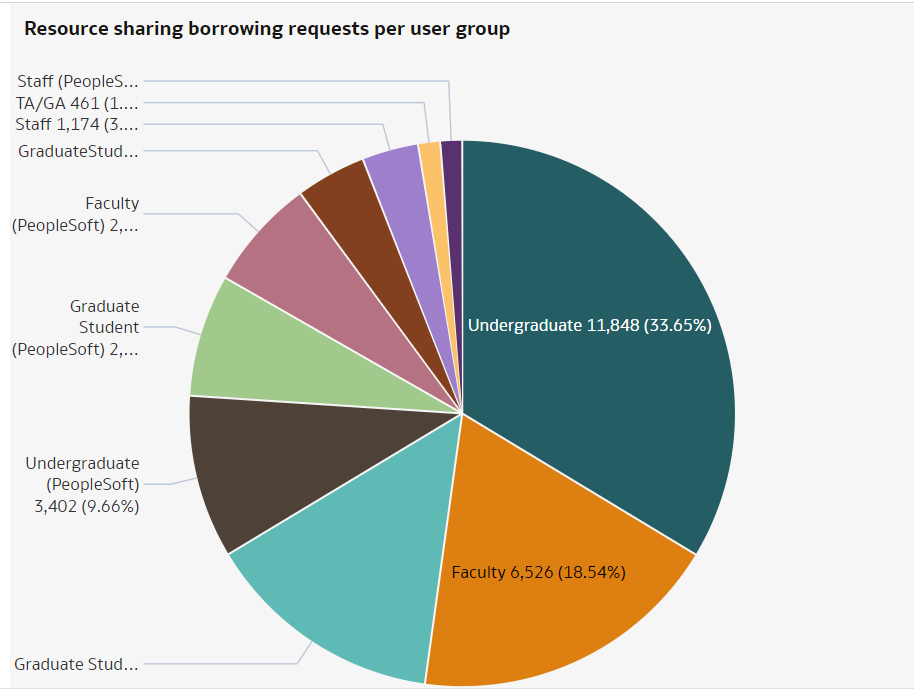
Access out of the box reports, widgets, and dashboard to review request aspects of borrowing resource sharing including filled and unfilled percentages, cancellation reasons, turnaround times per request type and per partner, most requested titles. requests marked for copyright, requests per user group, use of cloud app integrations, yearly trends and more.
Customize these reports and dashboards to further personalize and refine your analytics experience.