Overview of Primo Analytics
If you are working with Primo VE and not Primo, see Primo VE Analytics.
Primo Analytics enables Primo Cloud customers to run reports on library activities. You can use out-of-the-box reports that are provided by Ex Libris, or you can create your own reports. Groups of reports can be displayed in dashboards that you customize. You can share reports and dashboards that you create with other Primo users in your institution or in other institutions. These reports help you to understand the activities that your library performs and to make informed decisions on how to run the library.
Primo Analytics is built on OAS (Oracle Analytics Server), which replaced Oracle OBI in late 2020. This document describes unique aspects of this tool for Primo customers and basic analytics activities. For a thorough description of all the activities available in Primo Analytics, click the Help button to view the online help and Oracle documentation. For more information about OAS, see What's New in Analytics with OAS (Oracle Analytics Server) in the Ex Libris Developer Network.
This page describes how to perform basic activities such as building, formatting, and customizing Primo reports and how to provide reports to others, both internally and externally, by creating and updating dashboards.
Terminology
The following table describes various terms used for Primo Analytics and its user interface.
| Term | Description |
|---|---|
|
Attribute |
A column in subject areas that holds a flat list of values that are also known as members. |
|
Dashboard |
A personal collection of Analytics reports that may be viewed at a glance. The Example Dashboard includes tabs for the following reports:
The Trends Dashboard includes the Actions and Popular Searches reports as described above. For information on how create reports and dashboards, see the following documents, respectively:
|
|
Dimension |
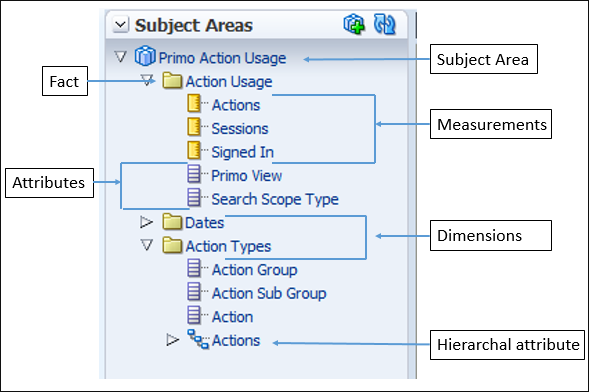
Tables that contain descriptive attributes (or fields) that are typically textual fields or discrete numbers behaving like text. Dimension attributes such as Dates, Action Types, or Institutions give facts a context. |
|
Fact Table |
Consists of the measurements, metrics, or facts related to a type of usage or process and contains the core part of the subject area. |
|
Hierarchical Attribute |
An attribute holds data values that are organized in a hierarchy. This kind of attribute is displayed using a treelike structure. Individual members are shown in an outline manner, with lower-level members rolling into higher- level members. |
|
Measurement |
A column of data in subject areas that holds a simple list of data values that can change or can be counted or aggregated in some way. |
|
Subject Area |
Data in Primo Analytics that is organized into subject areas such as Action Usage, Popular Searches, PNX Records, and Pipes. Subject areas contain folders, measure columns, attribute columns, and hierarchical columns. For more information, see Subject Areas. |
The following diagram illustrates where some of these elements exist in Primo Analytics:
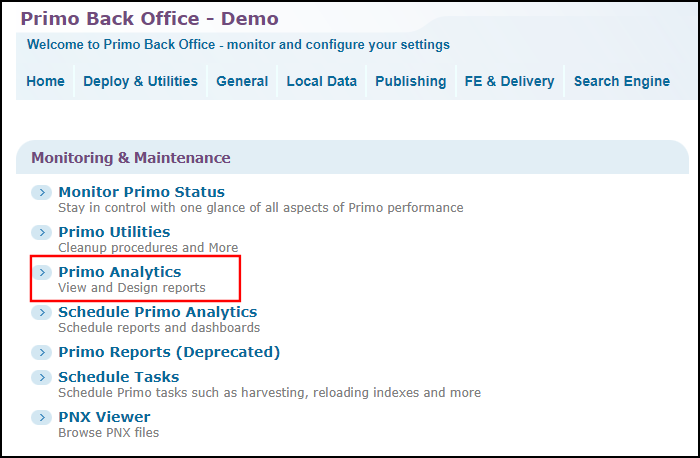
Accessing the Oracle Analytics Server for Primo
If you have a “central institution” that is used to harvest only shared data sources, accessing Primo Analytics with a user that belongs to this institution will enable you to view only operations related reports regarding pipes and PNX records. If the “central institution” has a view that is in use, you will also be able to view usage-related reports.
Under Monitoring & Maintenance in the Primo Back Office, select Primo Analytics.
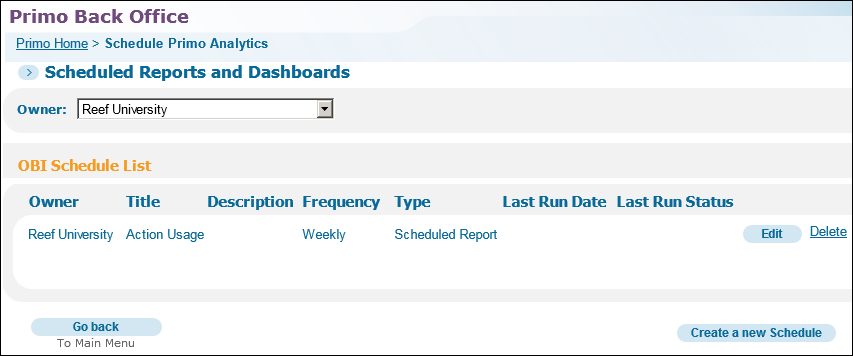
Scheduling Primo Analytics Reports
The Schedule Reports and Dashboards page (Primo Home > Schedule Primo Analytics) in the Primo Back Office allows you to create and modify report and dashboard jobs. In addition, the Last Run Date and Last Run Status columns allow you to monitor the status of your report and dashboard jobs.
For Primo VE environments, see Primo VE Analytics.
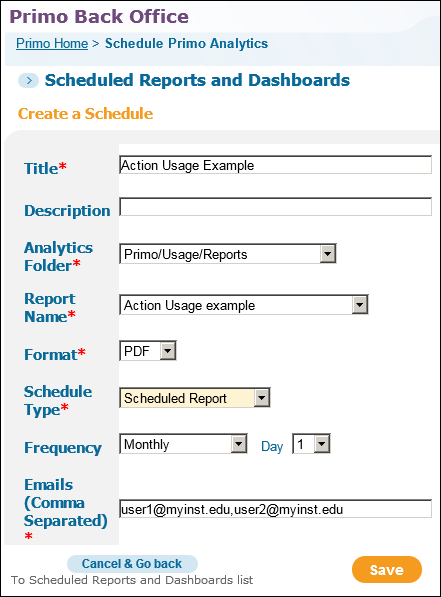
During the creation of a job, staff users will be able to specify the following fields on the Create a Schedule page:
-
Title – The report job’s name.
-
Description – An optional description of the report you are scheduling.
-
Analytics Folder – The Primo Analytics folder from which to select a report.
-
Report – The report or dashboard that you are scheduling.
-
Format – The output format of the report that you are scheduling. The following options are permitted for reports only: PDF, Excel, and Text. For dashboards, only PDF is permitted.
-
Schedule Type – Indicates the type of report that you are scheduling. Select either Scheduled Report or Scheduled Dashboard.
-
Frequency – Indicates how the job should be run. When scheduled, the job will run at 2AM on the scheduled day. The following frequencies are supported:
-
Monthly – allows you to specify the day of the month.
-
Weekly – allows you to specify a day of the week.
-
Daily – allows you to run the job daily.
-
-
Emails – A comma-separated list of email addresses to which the report is sent.