
Rialto Analytics Use and Cost Dashboard
The Rialto Analytics Use and Cost dashboard enables users to view use and cost information about their Rialto resources, both physical and electronic. You access the dashboard from Main Analytics menu > Access Analytics > Catalog > My Shared Folders > Rialto > Data Visualization. Select Open to display the dashboard:
The dashboard contains two overview tabs with high-level graphs using data from multiple Analytics subject areas and several additional detail tabs with information at the title level. All data is filtered to Rialto resources and ordered by fiscal year. The tabs display information on the following kinds of resources:
- Physical Books
- Electronic resources
- Click-throughs
- Detailed Cost/Usage data plus top 10 LCSHs
The following is a summary of the tabs available on the dashboard:
- Overview tabs – these tabs display high-level graphs using data from multiple Analytics subject areas:
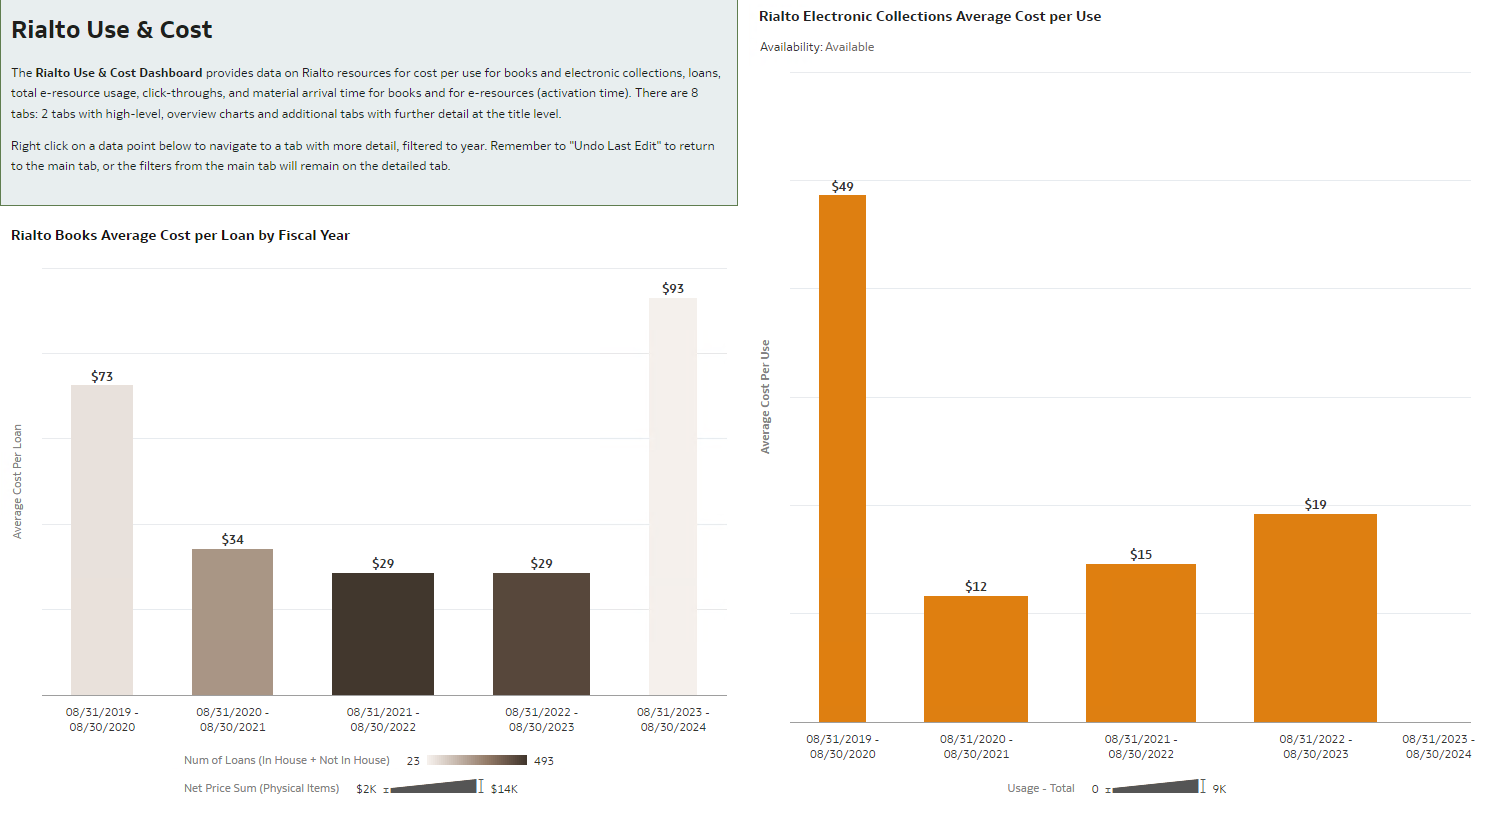
- Overview Rialto Average Cost Per Use – displays graphs of the electronic collections average cost per use and the books average cost per loan by fiscal year
- Overview Rialto Usage – displays graphs of the physical book loans by fiscal year, electronic collection use by fiscal year, and click-throughs by fiscal year
- Detail tabs – additional tabs that display information at the title level with information at the title level
- Rialto Click-Throughs – a click-through is when a user selects View It from Primo. By default, this tab displays a graph and a table of the click-throughs by fiscal year for Material Type: Book. From the filters at the top of the page, you can filter the results by a different material type, by a specific fiscal year, by date, and title.
- Rialto E-Portfolio Activation – displays graphs of the average number of days for Rialto e-resource activation from the date the PO line was sent to the vendor until the date that the e-resource was activated. From the filters at the top of the page, you can filter the results by fiscal period description, fiscal period, and electronic collection public name.
- Physical Books Days to Arrival – displays graphs of the number of days from the date that the PO Line was sent to the vendor until the date that the book arrived at the library. From the filters at the top of the page, you can filter the results by fund fiscal period description and title.
- Electronic Collection Cost & Usage – displays graphs of cost usage data for Rialto e-collections. From the filters at the top of the page, you can filter the results by fiscal period, fiscal period description, electronic collection public name, and LC Group 1 top level subject headings. The information on this tab is displayed according to the fiscal period.
- Rialto Book Loans – displays graphs of Rialto book loans. From the filters at the top of the page, you can filter the results by loan fiscal year, loan date, title, and and LC Group 1 top level subject headings.
- Physical Books Cost per Loan – displays graphs of costs per loan by fiscal year for Rialto physical books. From the filters at the top of the page, you can filter the results by fiscal period description, fund fiscal period, title, and LC Group 1 top level subject headings.
- Rialto Resources for Active Courses – displays a graph that displays the cost and number of orders per year for active courses and a table that displays detailed information on active courses taken from the Bibliographic Details folder in the Purchase Requests subject area.
From the overview tabs, you can right-click a data point and select a data action for that graph from the options in the menu that appears. (Each graph displays a different data action.) A tab for that data actions opens displaying detailed data that is filtered to the requested data point from the overview tab. Select the Undo icon to return to the Overview tab.