
Using Summon Analytics
-
Navigating Summon Analytics
-
Running out-of-the-box reports
-
Creating reports
-
Adding graphs to reports.
Navigating Summon Analytics
This section describes how to access the Summon Analytics and navigate among the various options.
-
Open the Summon Administration Console.
-
Click Usage at the top of the administration console
You can use the Global Header (which displays at the top of each page) to navigate between components in Summon Analytics.
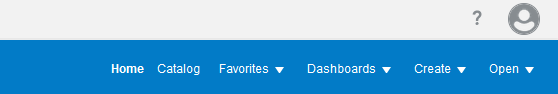
Global Header
The global header includes the following components:
-
Home– Displays the Home page
-
Catalog– The location where all reports are saved, including personal and shared reports. For more information, see Catalog.
-
Favorites-- access and manage your favorite reports and dashboards
-
Dashboards– A shortcut to all available dashboards that are saved in the dedicated dashboard subfolders.
-
Create – Displays a list of the OBA objects that can be created. This document describes the Analysis option (which creates new reports) and the Dashboard option (which creates dashboards). For more details on creating new reports, see Creating New Reports.
-
Open– Displays the following options:
-
Recent – Displays a list of the objects that you have recently viewed, created, or updated.
-
Most Popular Objects– Displays a list of the objects that are accessed the most often.
-
Above the header there are two icons.The following menu options can be accessed by clicking on the specific icon:
- User
- My Account– Displays the My Account page, which allows you to specify your preferences such as the timezone, delivery devices, and delivery profile.
- Sign Out-- signs out the current user
-
Question Mark
-
Oracle Analytics-- generic help documentation provided by Oracle
-
Catalog
The Catalog arranges reports and dashboards (grouping of reports) into folders. In addition to reports and dashboards, it is also possible to store report prompts as standalone objects.
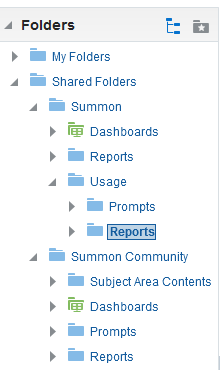
The Summon Analytics Catalog has the following folders, which display in the folder’s pane:
-
My Folders – Stores your personal reports and dashboard in subfolders. The content in this folder will not be shared with others in your institution or the Summon community.
-
Shared Folders – Stores reports, prompts and dashboards that can be shared at various levels in subfolders. The Shared Folders folder has the following subfolders:
-
Summon – Contains the out-of-the-box reports and dashboards created by Ex Libris. These reports cannot be modified directly, but you can copy them to My Folder and change them. The Summon folder contains the following subfolders:
Summon Subfolders Subfolder Description Dashboards
This subfolder contains the following dashboards:
-
Example Dashboard – This dashboard contains a tab for each Summon subject area.
-
Trends – This dashboard focuses on searches and usage.
Usage
This subfolder contains usage-related reports.
Prompts
This subfolder contains prompts.
Reports
This subfolder contains reports.
-
-
Summon Community – This folder contains reports and dashboards that are created by the entire Summon community. Reports placed in this folder can be viewed and edited by all Summon customers who have access to the OBI. The reports are shared across all regions using a scheduled synchronization that runs every week on Friday. You can copy these reports to your folders to make local modifications.
The Summon Community folder has the following out-of-the-box subfolders: Dashboard, Prompts, and Reports.
The Reports subfolder has a separate subfolder for each subject area, which are described in separate sections below. When adding reports to the Summon Community folder, make sure that you add reports to the appropriate folder and prefix the name of the reports with your institution name and a dash so that each report is identifiable by the contributing institution. For example:
-
U. Minn - Search Related Actions
-
U. Sienna - Sessions and Sign-in
Each institution can browse the folders for reports pertaining to a specific area or perform a search for reports from a specific institution.
Libraries are encouraged to add information in the properties of the reports so that other libraries are able to identify the functionality of the report easily. For example:
 Session Usage Example
 -
-
Home
Click the Home link to display the Summon Analytics home page:
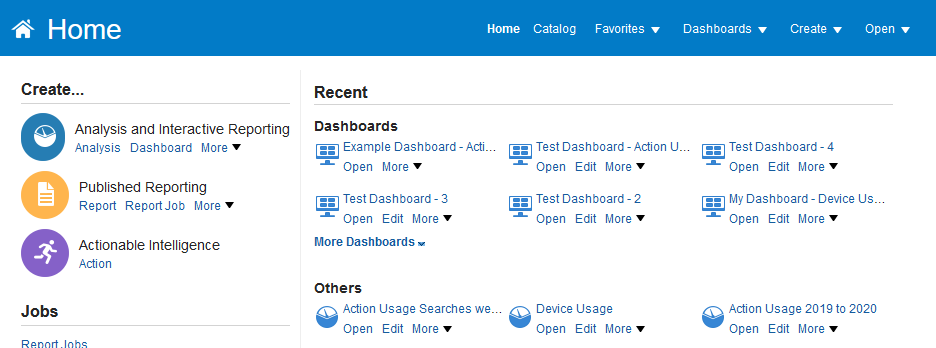
The Home page is a task-oriented, centralized workspace that is combined with a global header that provides access to Summon Analytics objects, their respective editors, help documentation, and other features.
Running the Out-Of-The-Box Reports
-
Click Catalog and then select the Summon folder under Shared Folders.
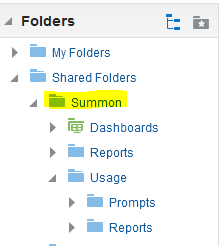 Shared Folders
 -
Click the expand buttons next to Shared folders > Summon > Usage > Reports—for example, the out-of-the-box reports that are related to Usage display:
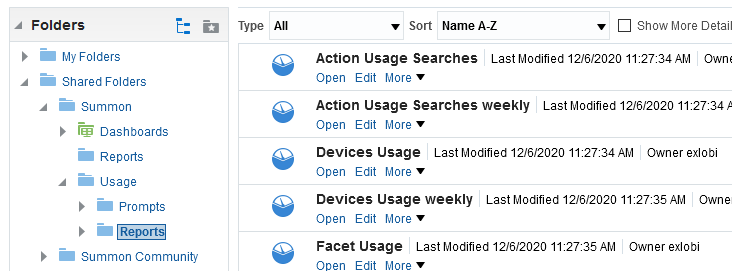 Usage Reports
 -
Click Open for the report that you want to run.
Displaying Dashboards
-
Click Catalog and then select the Summon folder under the Shared Folders.
-
Click the expand buttons next to Shared folders > Summon > Dashboards
-
Click Open for the dashboard you want to display.
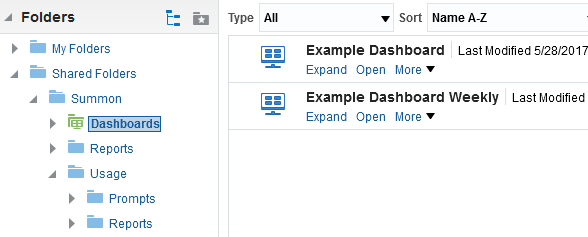 Dashboards
-
Click Catalog and then select the Summon Community folder under the Shared Folders.
-
Click the expand buttons next to Shared folders > Summon Community > Dashboards
-
Click Open for the dashboard you want to display.
-
Click Dashboards in the Global Header:
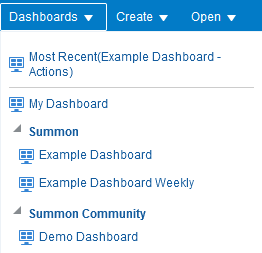 Dashboards
 -
Select the dashboard that you want to view under Summon or Summon Community. If you want to see your personal dashboard, click My Dashboard.
Copying Reports
-
Open the catalog and locate the report that you want to copy.
-
Select More > Copy.
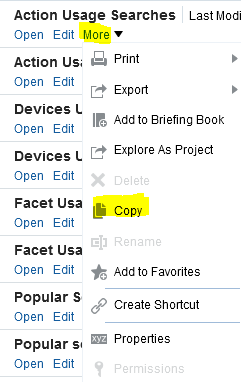 Selecting a Report to Copy
 -
Navigate to the target folder of the report under My Folders or Summon Community and select Paste under the Tasks pane.
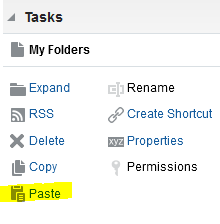 Pasting the Report in the Target Folder
Creating New Reports
-
Summon Action – Provides information on end user use of the various Summon functionality.
-
Summon Facets – Provides information on facet usage.
-
Summon Popular Searches – Lists the details for the most popular searches.
-
Summon Sessions – Provides information on Summon sessions.
-
Summon Zero Result Searches – Lists the details for searches that found no results.
Creating Basic Reports
The following procedure is a basic example of how to create a report:
-
Select Create > Analysis. The Select Subject Area menu opens.
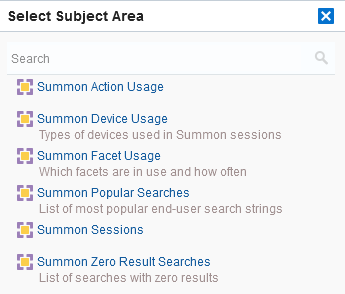 Select Subject Area Descriptions Menu
 -
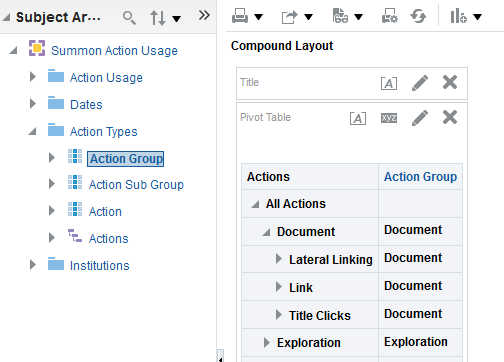
From the Select Subject Area menu, select the type of report you'd like to create. For this example we will create a Summon Action Usage report. This will bring us to the Analysis Editor. The left pane displays the elements of the Summon Actions Usage subject area:
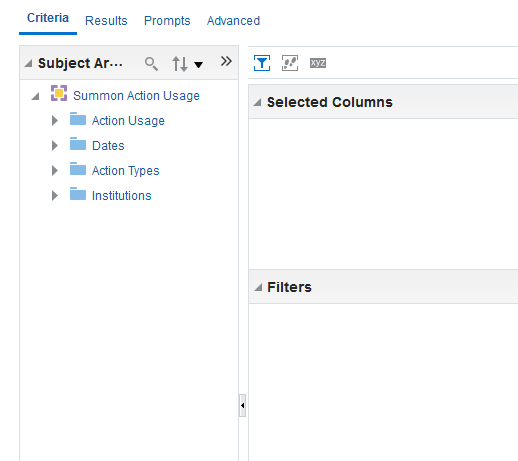 Analysis editor
 -
Click the arrow next to the Actions Type to expand the Actions Type dimension folder. Double-click the Action Group, Action Sub Group and Action fields (or drag and drop them into the Selected Columns pane).
-
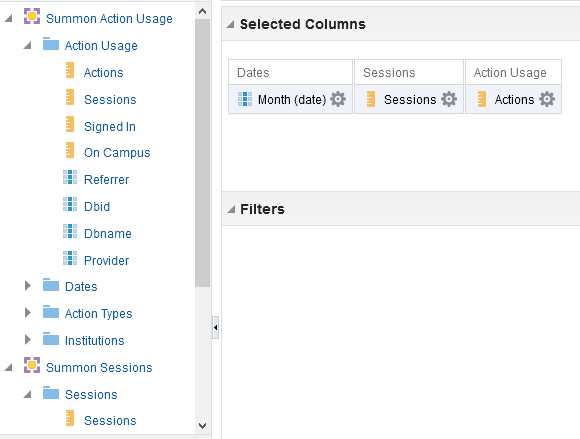
Click the arrow next to the Action Usage folder. Double-click or drag the items into the Selected Columns section:
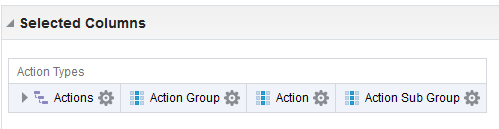 Selected Columns
You can reorder the columns in your report by clicking and dragging them to the new position.
-
Click the Results tab to see the report’s results.
Creating Advanced Reports
You may want to include information in a report from two subject areas. In order to be able to create reports from two subject areas, the following conditions must be met:
-
There must be at least one common dimension between the two subject areas.
-
Descriptive fields must come from the common dimensions.
If you attempt to create a report from two descriptive fields that are not in common between the two subject areas, an error message will display.
In this example, we create a report from the Actions Usage and Sessions to create a report that on the average number of actions per session.
-
Select Create > Analysis. The Select Subject Area menu opens.
Select Subject Area Descriptions Menu -
In the Select Subject Area menu, select Summon Action Usage — for example, to open the Analysis Editor.
Analysis Editor -
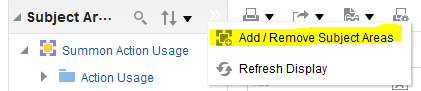
In the left pane, click Add/Remove Subject Areas (you may need to click the double arrow to make the menu item visible).
 Summon Action Usage and Summon Session Subject Areas
 -
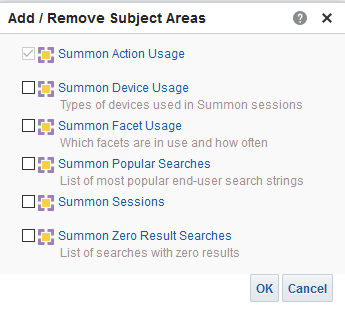
Select Summon Sessions from the Add/Remove Subject Areas window and then select OK.
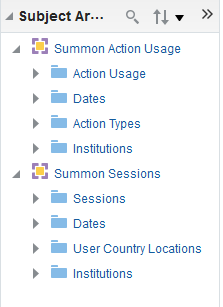
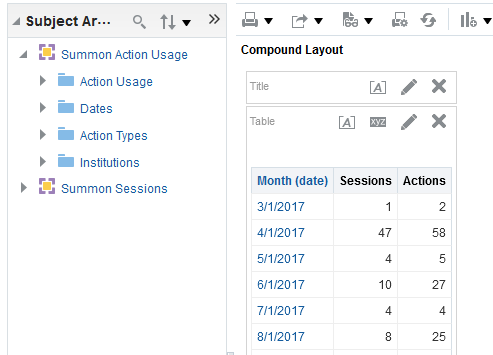
You should now be able to see both subject areas in the left-hand window:
-
The Action Usage and Sessions subject areas have the Dates dimension in common. Add any date type to the report as well as any measurement dimensions. For example, select Sessions from the Sessions column and Actions from the Action Usage column.
-
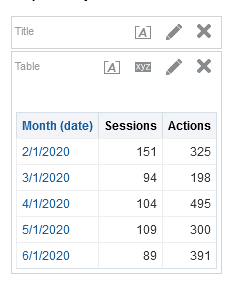
Select Results to see sessions and actions grouped by date:
Filtering a Report
-
Select the More Options (gear) icon next to the column you'd like to filter and select Filter.
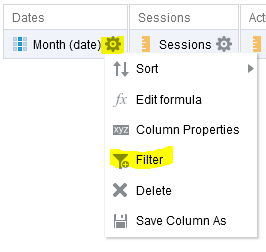
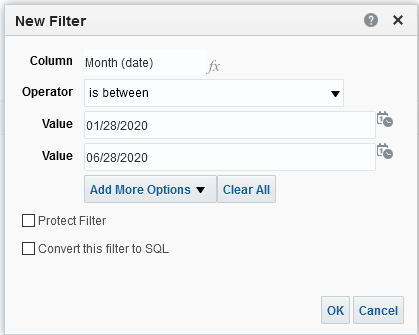
The New filter dialog Box opens:
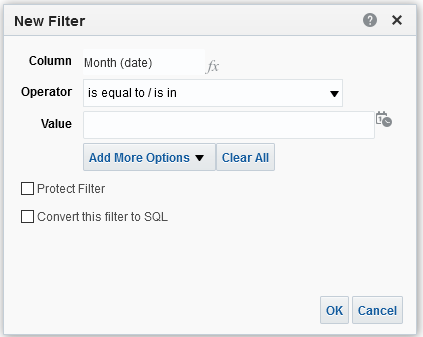
-
Select an option from the Operator drop-down list. Available operators and how they work can be found here.
-
Enter a value in the Value field. For example, if we wanted only information from January to June 2020, we would enter that information via the date picker or by manually typing it in:
Optionally, you can Protect Filter (to prevent other prompts from overriding it).
-
Select the Results tab to display the results filtered according to the criteria that you set:
Sorting a Report
-
Click the More Options (gear) icon next to the column whose data you want to sort and then select Sort.
-
Select a sort option to sort the column.
Saving a Report
-
My Folders – Area reserved for private reports.
-
Shared Folders – Area reserved for shared reports. Place all shared reports in the appropriate folder under Summon Community. Do not forget to prefix the report with your institution name and to include a description of the report.
-
Click the Save icon (on the far right under the Global Header):
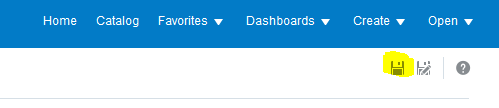
-
This opens the Save As dialog box.
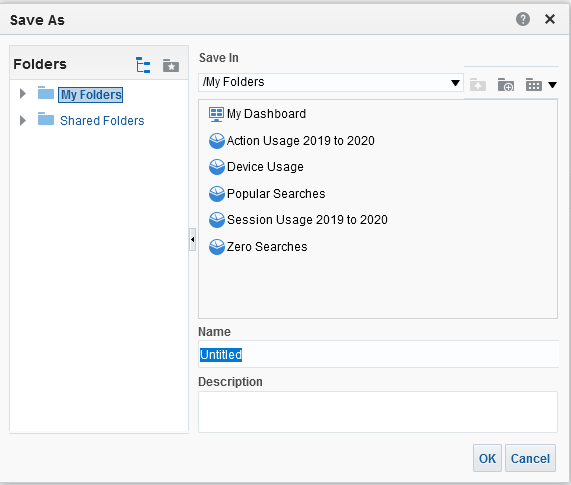 Save As Dialog Box
 -
Select a folder under either the My Folders area (for private usage) or the Shared Folders are (for shared usage).
-
Specify a name and a description for the new report in the corresponding fields.
-
Click OK.
Adding a Graph to a Report
You can add a graph, such as a pie chart, to the report.
On the Results tab, click the New View (graph) icon and select Graph:
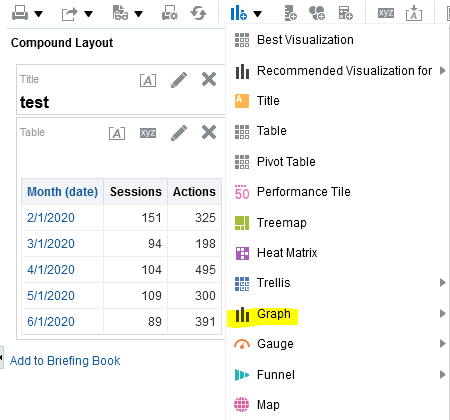
A graph in the style chosen will appear in the Compound Layout area. In this example a line chart is displayed:

Creating a Dashboard
-
From the global header, click Create > Dashboard to open the new Dashboard Dialog box:
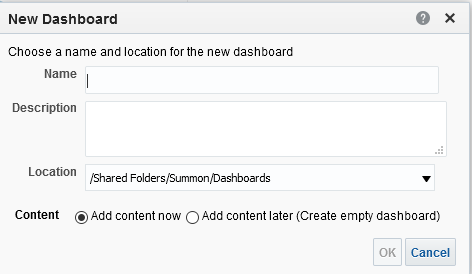 New Dashboard Dialog Box
 -
Enter the following information:
-
Name – Enter a name for the dashboard.
-
Description – Enter a description for the dashboard.
-
Location – Enter the location where you want the dashboard to be saved.
-
Content – If you want to add content now, select Add content now, which is the default option. If you want to add content later and create an empty dashboard, select Add content later (Create empty dashboard).
-
-
Select OK.
-
If you want to create a dashboard with reports from your local institution folder, drag and drop reports from your institution’s folder in the Catalog pane to the drag-and-drop area in the right pane:

-
Clicking Preview in the upper right-hand corner will open an example dashboard display in a new tab:
-
If you want to use an out-of-the-box report in a dashboard, you must first copy it to your local institution. Follow the instructions for how to copy a report earlier in this document.