Out-Of-The-Box Dashboards and Reports
This pages describes the out-of-the-box dashboards and reports provided for you in Summon Analytics.
Summon Title Report
The Title Report, which is located under Shared Folders > Summon > Reports on the Catalog page, tracks per week the number of times a database was accessed by clicking a title of a database's article, eBook, and so forth from Summon.

Summon Title Report
Example Dashboards
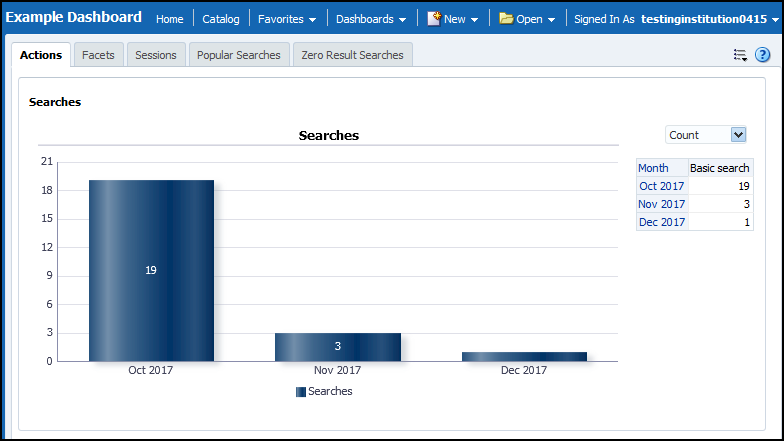
The Example dashboard includes a tab for every Subject Area except for Device Usage. Selecting a tab in the dashboard opens the associated report.

Example Dashboard Tabs
Example Reports
The following table lists the out-of-the-box reports based on subject area. For more details, see Subject Areas.
| Subject Area | Description |
|---|---|
|
A monthly report of the actions taken in Summon by end-users.
Using the prompt at the top of the report it is possible to display a report by the number of actions per month, number of sessions in which actions were invoked or number of times the action was invoked when the user was signed in.
There are separate reports for each Action sub group: Search, Results List, Document, and General.
|
|
|
A monthly report of the number of times specific devices were used. |
|
|
A monthly report of the number of times specific facets were used.
Using the prompt at the top, it is possible to display the number of sessions in which specific facets were used.
|
|
|
The tab displays two reports – a monthly report of the most popular searches and a report of the most popular searches for the entire year.
|
|
|
A monthly report of the number of sessions divided by the location (country) of the end-user.
Using the prompt at the top, it is possible to display a report for the average duration of sessions, total number of actions taken and number of times users signed-in within a session.
|
|
|
A report of searches that found no results.
|

