
Creating a Dashboard
You can create dashboards, which include Analytics reports and display them by selecting the Analytics link at the top of every page.
To create a dashboard:
- Select New > Dashboard. The following is displayed:
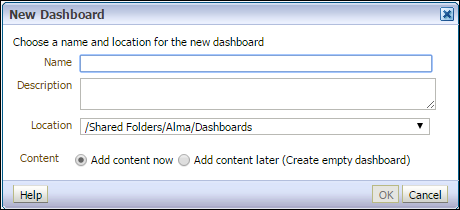 New Dashboard
 - Enter the following information:
- Name – Enter a name for the dashboard. Note that the name of the dashboard should not contain the following characters: ampersands (&), commas (,) , semicolons (;), colons (:), hashtags (#) , or slashes (/)
- Description – Enter a description of the dashboard
- Location – Enter the location where you want the dashboard to be saved. Dashboards must be saved under a Dashboards folder, such as Alma > Industry Statistics > Dashboards.
- Content – To add content now and navigate to the newly created dashboard, select Add content now. To add content later and not leave the current page, select Add content later (Create empty dashboard).
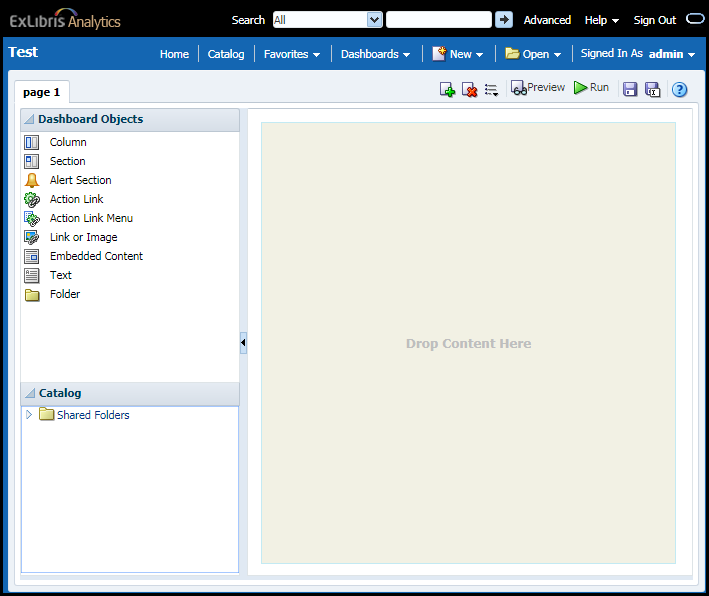
- Select OK. If you selected Add content now, the empty dashboard appears:
 Selecting Reports for Dashboard
 - To create the dashboard with reports from your local institution folder, drag and drop reports from a folder of your institution in the Catalog pane into the right pane. For example (this example uses Alma subject areas):
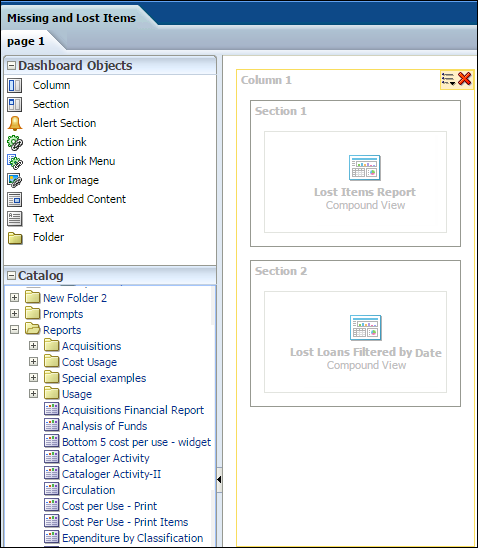 New Dashboard with Reports
 - To use an out-of-the-box report in a dashboard, you must first copy it to your local institution (the example uses Alma subject areas):
- Select Catalog to open the list of folders:
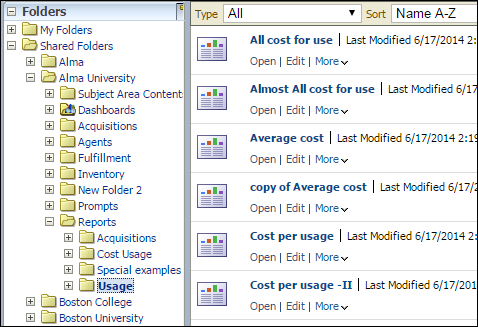 List of Folders
 - Select More > Copy for the report that you want to copy to your local institution folder.
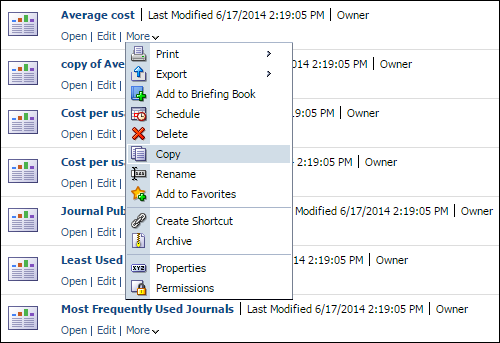 Copy Report
 - Move to your local institution folder and select More > Paste to paste the out-of-the-box report to your local folder.
- Select Catalog to open the list of folders:
You cannot add reports to a dashboard directly from My Folder. Move the reports to your institution folder (as described above for out-of-the-box-reports) and then add the report to the dashboard.