Common Analytics Procedures
- Last updated
- Save as PDF
For a list of How To Analytics documents, see Presentations and Documents - Analytics.
This section contains a cookbook of procedures that illustrate of how to use Analytics.
Formatting Procedures
Number of Decimal Places
You can set the number of decimal places for numbers in an Analytics report.
To set the number of decimal places for sums:
- From the Analytics dashboard, select New > Analysis and then select Select Subject Area > Fines and Fees.
- Select the following columns from the Fines and Fees Transactions dimension:
- Fine and Fee Status
- Fine Fee Transaction Modification Date
- Original Amount
- From the User Details subject area select the following:
- User Name
- First Name
- Last Name
- Select the Results tab. In the following example, the sums are rounded up to whole numbers. For example, 29 is rounded up from 28.5:
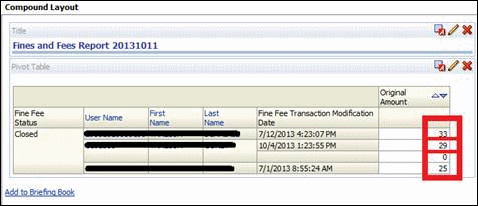 Sums Rounded Up
 - Select the Criteria tab to view the columns of the report.
- From the column that contains the sum (in our example the Original amount column) select the More Options icon
 and select Column Properties from the drop-down list.
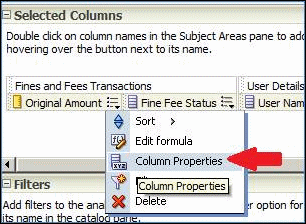 Column Properties OptionThe Column Properties dialog box appears.
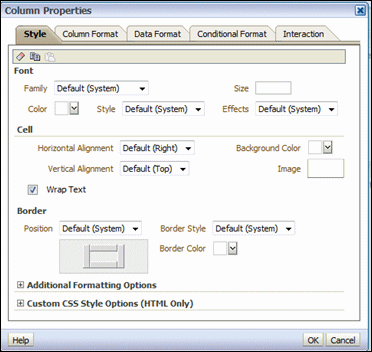 Column Properties Dialog Box
 - Select the Data Format tab.
- Select the Override Default Data checkbox. Note that Decimal Places is set to 0.
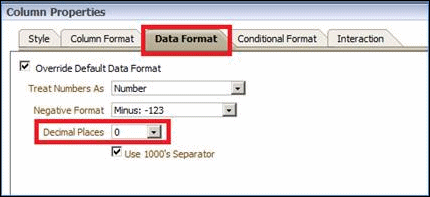 Data Format Tab
 - From the Decimal Places drop-down list, select 2:
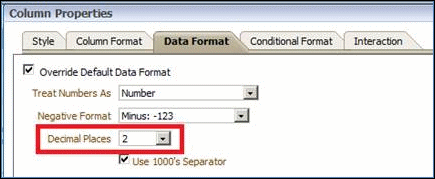 Decimal Places
 - Save the report and select the Results tab. The sums appear as two decimal places and the report displays 28.50 instead of 29:
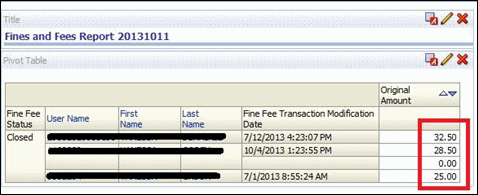 Sums Not Rounded Up
Currency Symbols
To add currency symbols to numbers:
- From Analytics, select New > Analysis and then select Select Subject Area > Funds Expenditure.
- Create a report with the following columns:
- Library Name
- Vendor Name
- Transaction Amount
- Select the More Options icon
 for Transaction Amount and select Column Properties from the drop-down list.
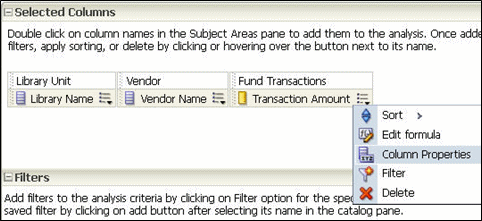 Column PropertiesThe following is displayed:
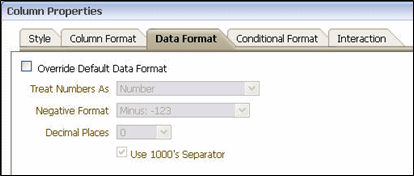 Data Format
 - Select the Data Format tab.
- Select the Override Default Data Format check box.
- From the Treat Number As drop-down list, select Currency. The Currency Symbol drop-down list appears.
- From the Currency Symbol drop-down list, select a currency symbol.
- From the Decimal Places drop-down list, select the number of decimal places to which you want the results displayed.
- Select the Use 1000's Separator check box to display the 1000's separator in the results.
- Select OK.
- Save the analysis.
- Select the Results tab to display the report with a currency symbol displayed in the Transaction Amount column, for example:
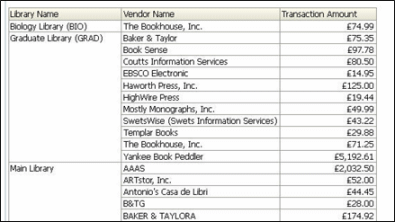 Report
Additional Text
You can configure Analytics to automatically add text to the results of a report. In the following example, the characters ### are added to the results of a report.
To add text to the results of a report:
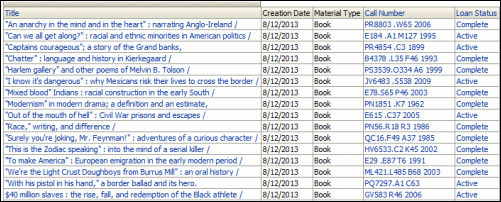
Example Report
- From Analytics, select New > Analysis and then select Select Subject Area > Fulfillment.
- Create a report with the following columns, for example:
- Bibliographic Details > Title
- Physical Item Details > Creation Date
- Physical Item Details > Material Type
- Loan Details > Call Number
- Loan Details > Loan Status
The following is an example of a report: - From the field to which you want to add text, select the More Options icon
 and select Edit Formula. The Edit Column Formula page is displayed:
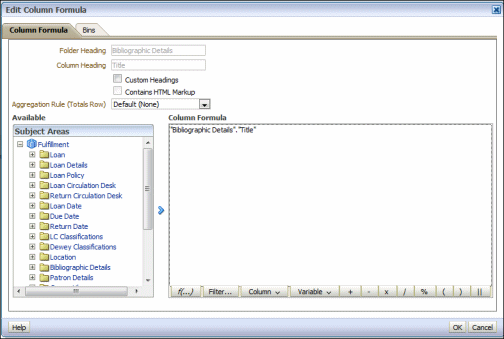 Edit Column Formula
 - Insert the double pipe (||) symbol after the existing column formula by entering it manually or by selecting the double pipe symbol at the bottom of the page.
- After the double pipe symbol, enter the text you want to add surrounded by single quotes, and select OK. In this example, we add ‘###’.
 Column Formula with Text to Be AddedThe text is added to the results and the column name.
 Report with Added Text
 - To remove the text from the column heading, select the More Options icon
 and select Column Properties > Column Format. The Column Format tab appears:
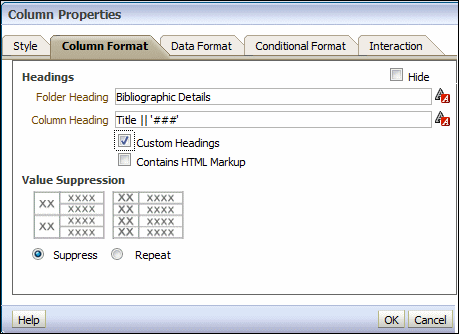 Column Format
 - Select Custom Headings and change the column heading name.
- Select OK. The column heading is changed.
 Report
License Obligation Notes
You can display the obligations note for licenses in reports from the Licenses subject area. This note indicates if you can cancel the license.
To display the obligations note for licenses in reports:
- Create an analytics report using the License Term Section and License Term Value fields.
- Filter License Term Section by Obligation. For example:
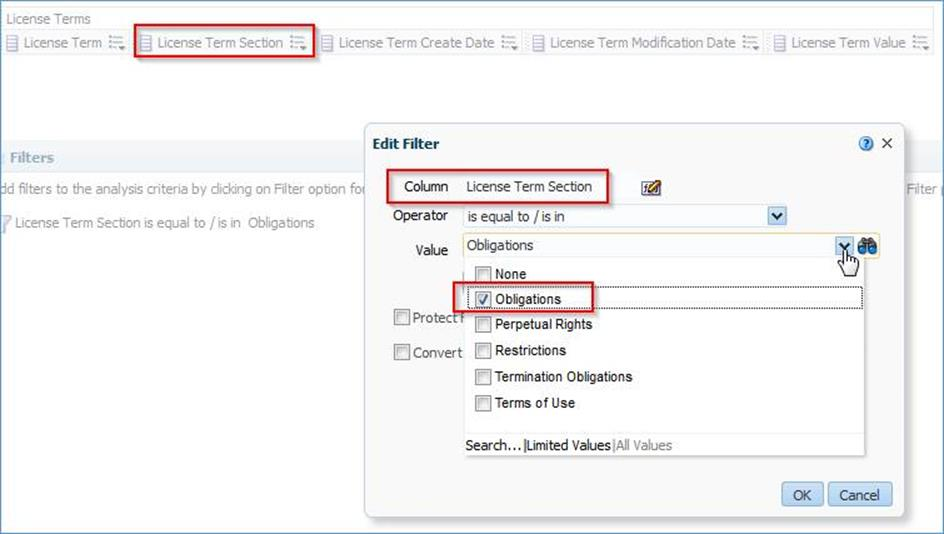 Filter License Term Section by Obligation
 - Run the report. The obligations note appears in the License Term Value field. For example:
 Obligations Note
Values on the Top of Each Bar of a Bar Graph
This section describes how to display values on the top of each bar of an Analytics bar graph.
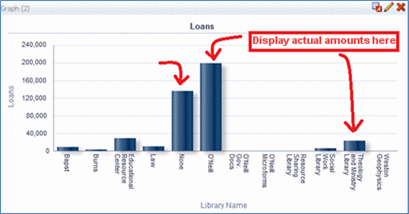
Values on Top of Each Bar
To display values on the top of each bar of an Analytics bar graph:
- From Analytics, select New > Analysis and then select Select Subject Area > Fulfillment.
- Create a report with the following columns, for example:
- Loan > Loans
- Location > Library Name
- Select the My View icon
 and then select Graph > Bar > Default (Vertical).
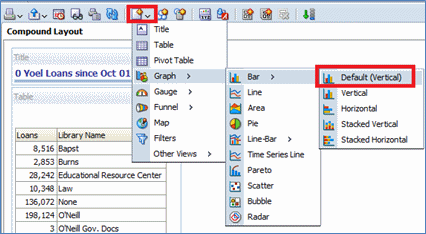 Default Bar Graph
 - From the Results tab, select the Edit icon
 to edit the graph:
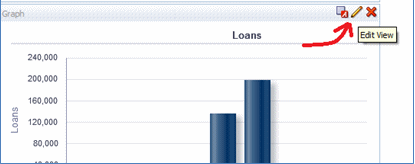 Pencil Icon
 - Select the Edit Graph Properties icon
 :
:
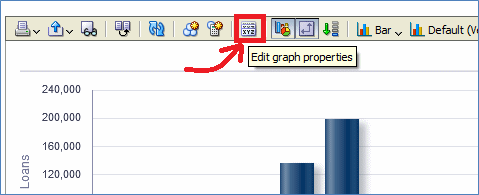 Edit Graph Properties
 - From the Titles and Labels tab, select Data Labels:
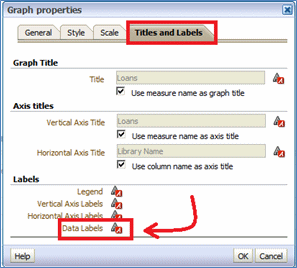 Titles and Labels
 - From the Display Options tab, select Always:
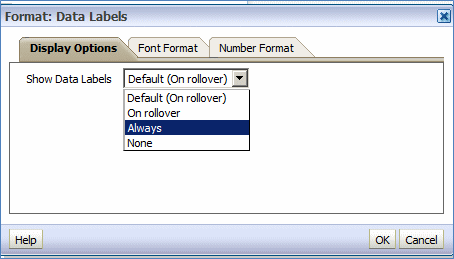 Display OptionsValues are now displayed on the top of each bar of the bar graph:
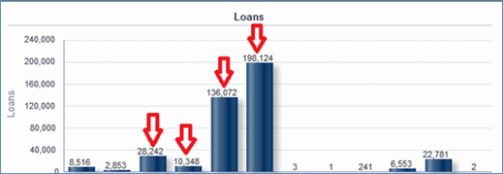 Values on Top of Each Bar
Export Link (Dashboards)
You can add an Export link to reports that you put into dashboards. The dashboard is exported to Excel.
You can add an Export link only to dashboards that you create, not out-of-the-box dashboards.
To add an Export link in dashboards:
- Select the Page options icon
 in the top-right of the page of the dashboard and select Edit Dashboard. The dashboard moves to edit mode.
 - Select the report to which you want to add the Export link.
- Select the Properties icon
 in the report and select Report Links. The following appears:
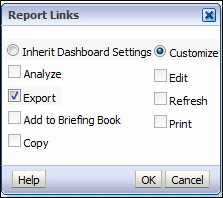 Report Links
 - Select Customize and Export and select OK.
- Select the Save icon

- Select Run.
The Export link is added to the bottom of the report:
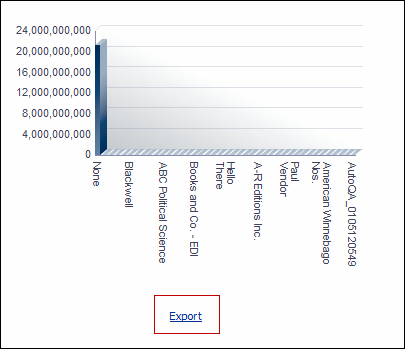 Export Link
Functional Procedures
Subtotals
This section describes how to add a subtotal to your report and the impact of the order of the columns on your subtotals.
To create an analytics report with a subtotal:
- From Analytics, select New > Analysis and then select Select Subject Area > Fulfillment.
- Create a report with the following columns:
- Location > Library Code
- Location > Location Code
- Loan Date > Loan Year
- Loan Date > Loan Full Month
- Loan > Loans (a measurement)
- Select the Results tab to display the report. For example:
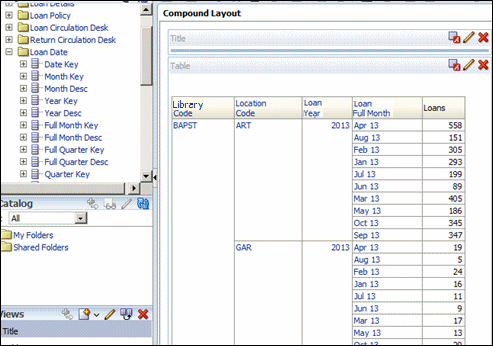 Loan Year and Loan Full Month Desc Columns
 - Calculate a subtotal of each library for the entire range. (This is relevant because the loans per month are displayed.)
- Select the Edit icon
 to display Edit view.
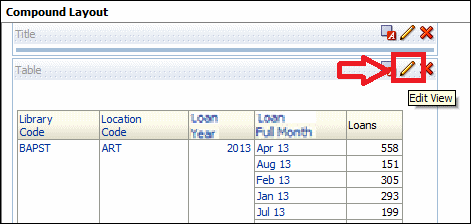 Edit View
 - For the column that you want to calculate a subtotal, select the Sigma icon
 and then select After. In the following example, this is performed in the Location > Location Code column:
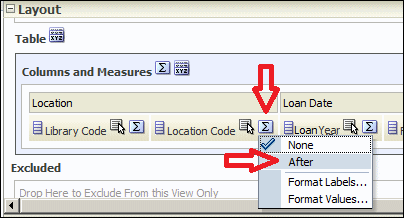 After OptionThe subtotals are now displayed:
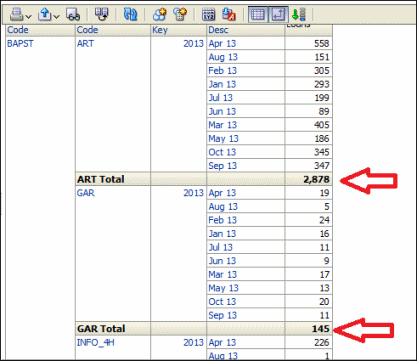 Subtotals
- Select the Edit icon
Mathematical Formulas
In the following example, one column displays the number of loans and a second column displays the number of loan days. A third column is created that displays the number of loan days divided by the number of loans. This may be useful for seeing high and low usage of items in order to decide where new items need to be purchased and where items can be withdrawn.
To create this analytics report:
- From Analytics, select New > Analysis and then select Select Subject Area > Fulfillment.
- Create a report with the following columns:
- Library Name
- Loans
- Loan Days
- Loan Date
The criteria for the report appear as follows: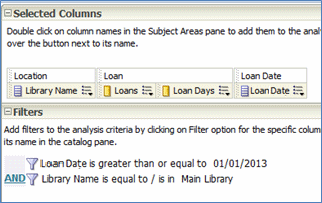 Selected Columns
 - Select the Results tab. The following is an example of the results:
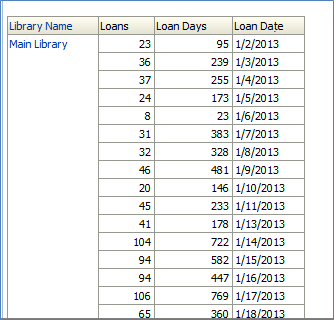 Report
 - Select the Criteria tab and add a new column of any kind.
- Select the More Options icon
 of the new column and select Edit Formula. The Column Formula dialog box is displayed:
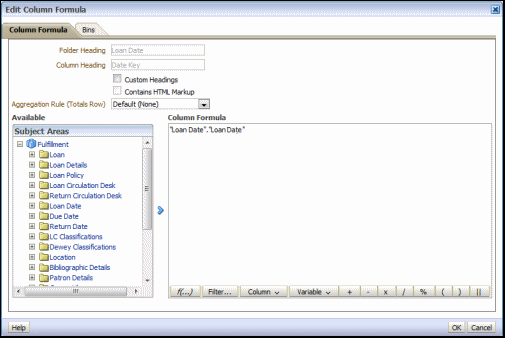 Column Formula
 - Delete the existing formula.
- Enter "Loan"."Loan Days"/"Loan"."Loans"
- Select the More Options icon
 of the new column and select Column Properties > Column Format and enter a new name for the column in the Column Heading field.
 - Select the More Options icon
 of the new column and select Column Properties. The column Properties dialog box appears:
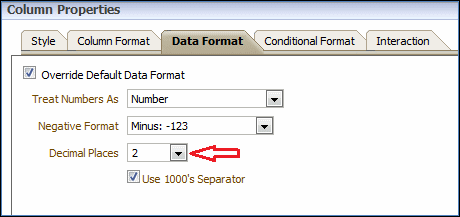 Column Properties
 - From the Data Format tab, select a number of decimal places from the drop-down list.
The following is an example of the results:
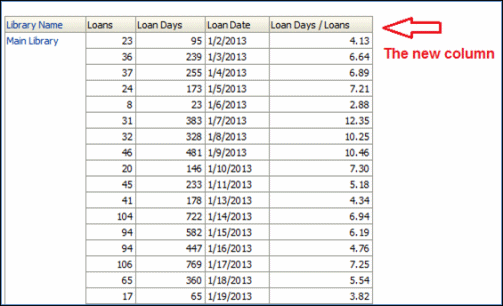 Analytics Report
In the following example, the number of days between the date an order is sent to a vendor and the date the item is received. This may be useful for seeing which vendors are the fastest to respond and which vendors are the slowest to respond.
To create this report:

Selected Columns
- From Analytics, select New > Analysis and then select Select Subject Area > Fulfillment.
- Create a report with the following columns:
- PO Line > Send Date
- Physical Item Details > Receiving Date
- Bibliographic Details > Title
- PO Line > Vendor Account Description
The criteria for the report appear as follows: - Select the Results tab. The following is an example of the results:
 Report
 - Select the Criteria tab and add a new column of any kind.
- Select the More Options icon
 of the new column and select Edit Formula. The Column Formula dialog box is displayed:
 Column Formula
 - Delete the existing formula.
- Enter TIMESTAMPDIFF(SQL_TSI_DAY,"PO Line"."Sent Date","Physical Item Details"."Receiving Date")
The following are the elements of the formula:
- TIMESTAMPDIFF – display the difference of two dates
- SQL_TSI_DAY – display the unit in days
- The first value (PO Line.Sent Date) – the date from which you want to subtract
- The second value (Physical Item Details.Receiving Date)– the date to subtract.
- Select the More Options icon
 of the new column and select Column Properties > Column Format and enter a new name for the column in the Column Heading field.
The following is an example of the results:
 ReportThe Days to Arrive column displays the number of days from when the item was ordered until it was received.
Concatenated Fields
You may want to put two fields together and have text between them. For example, you now have library code and item ID in two separate columns and you want to have library code, space, dash, space, and then item ID in one column. This section describes one way of doing this.
If you are using an Analytics report that combines subject areas, the fields that you are concatenating should be in the same subject area.
To concatenate two or more fields in an Analytics report:
- From Analytics, select New > Analysis and then select Select Subject Area > Fulfillment.
- Create a report with the following columns, for example:
- Loan Details > Item ID
- Loan Details > Barcode
- Location > Library Code
- From the Physical Items Subject Area, add Item Creation Date > Item Creation Date.
 Selected Columns
 - Select the Results tab and verify that the results have the columns that you want to concatenate:
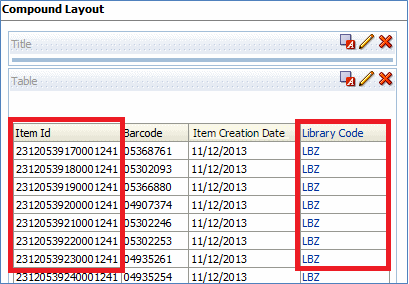 Compound Layout
 - In the Criteria tab of each column that you want to concatenate, select the More Options icon
 and then select Edit Formula:
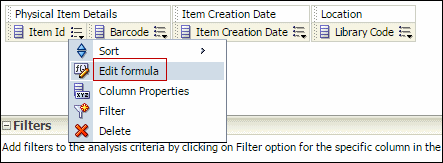 Edit FormulaThe formula of the column appears:
 Column FormulaNote that the Item ID is "Physical Item Details"."Item Id" and that the Library Code is "Location"."Library Code".
 - Select the More Options icon
 and then select Edit Formula for one of the fields that you want to concatenate:
Edit FormulaAfter the existing field, add a pipe and then the field (or fields) that you want to appear. For example:"Location"."Library Code"||"Physical Item Details"."Item Id"
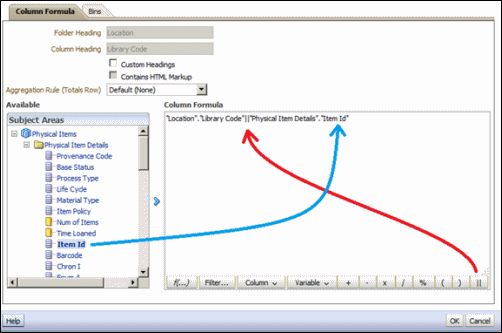 Column Formula
 - Select the Results tab. The column now contains both the library code and the item ID:
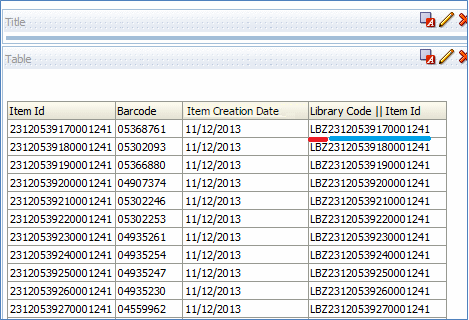 Library Code and Item ID
 - Select the More Options icon
 and then select Edit Formula.
 - Add a “space dash space” surrounded by single quotes and another double pipe between the Library Code and the Item ID.
Change the following:"Location"."Library Code"||"Physical Item Details"."Item Id"To the following:"Location"."Library Code"|| '-' ||"Physical Item Details"."Item Id"
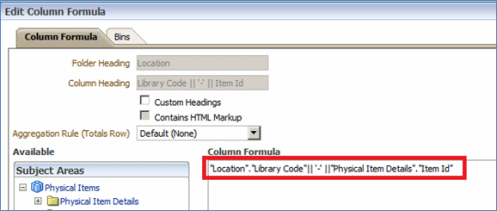 Edit Column Formula
 - Select the Results tab. The field is concatenated with a space dash space between each part:
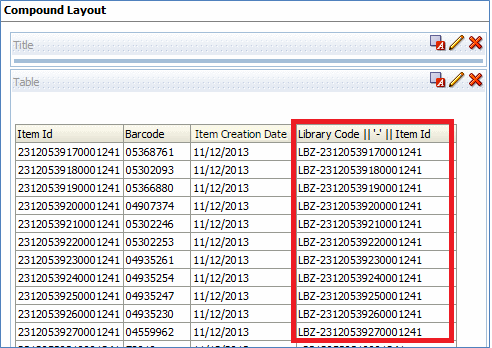 Compound Layout
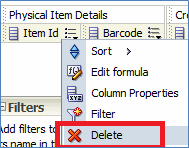
 - Delete the non-desired field by selecting the More Options icon
 and selecting Delete.
 Delete
 - Rename the concatenated field:
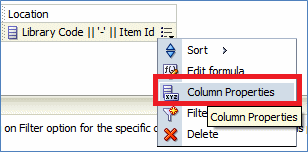
- Select the More Options icon
 and select Column Properties:
 Column Properties
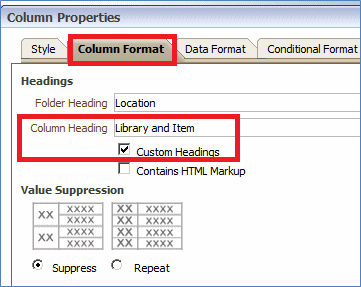
 - Enter a new name in the Column Heading field.
- Select the Custom Headings check box.
 Column Heading
- Select the More Options icon
- Select the Results tab to see the results:
 Compound Layout
Bibliographic Records with Multi-library Holdings
This report displays all bibliographic records that have holdings in more than one library.
To create a report of all bibliographic records that have holdings in more than one library:
- From Analytics, select New > Analysis and then select Select Subject Area > Physical Items.
- Create a report with the following columns, for example:
- Bibliographic Details > MMSID
- Bibliographic Details > Title
- Another field to serve as a placeholder for a column. (It does not matter what it is, because its formula will be changed.) For example, Physical Item Details > Provenance Code.
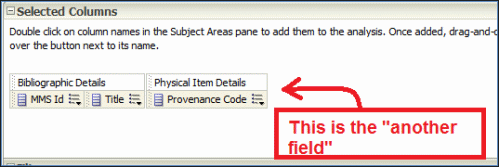 Selected Columns
- In the lower pane, add a filter for Physical Item Details.Lifecycle to be active so that the report does not include deleted items.
 Create Filter
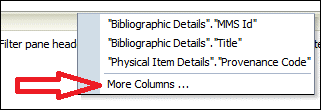 More Columns
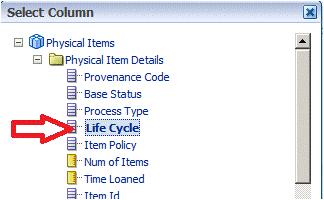 Lifecycle
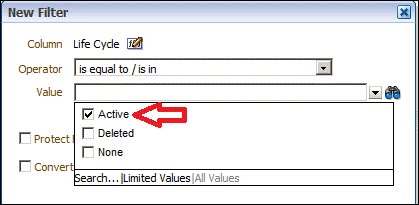 Active
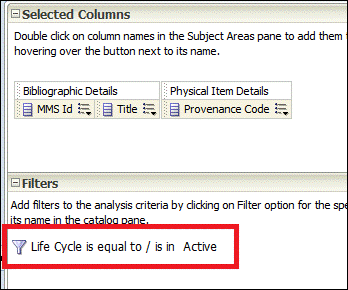 Lifecycle is Equal to Active
 - Edit the formula of Physical Item Details > Provenance Code (the placeholder column) to perform a distinct count of library codes related to the bibliographic record.
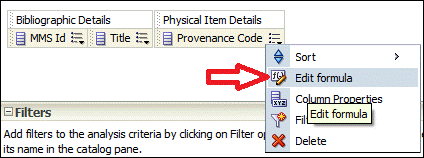 Edit Formula
 - Remove the existing formula and add a function for a distinct count.
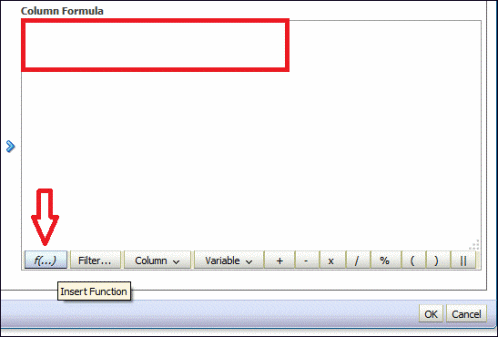 Insert Function
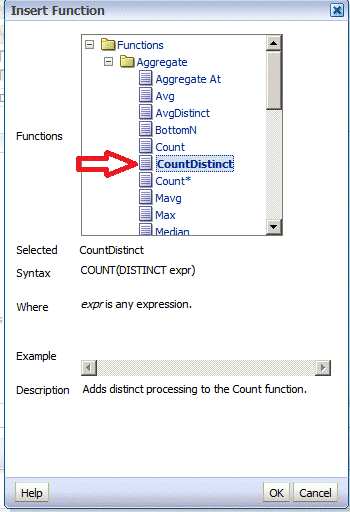 Count DistinctThe formula is now COUNT(DISTINCT expr).
 Column Formula
 - Change the Column Formula to count the library code by the MMS Id:
COUNT(DISTINCT "Location"."Library Code" by "Bibliographic Details"."MMS Id")
- Change the column header to an appropriate name, for example, Number of libraries.
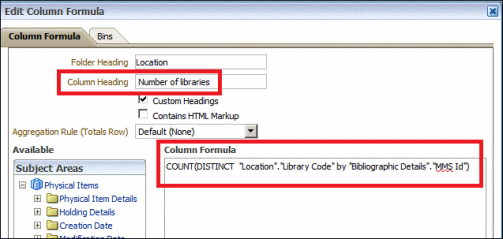 Edit Column Formula
 - Filter the column with the count of libraries to have only rows with two or more libraries (is greater than or equal to 2):
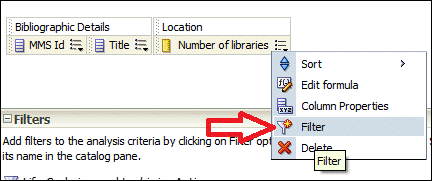 Filter
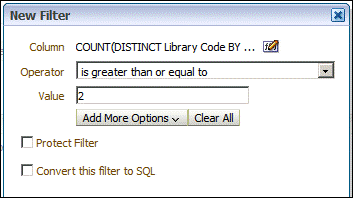 New Filter
 Filters
 - Select the Criteria tab to display the results. For example:
- MMS ID 991105780000121 Danmarks kirker – which has holdings in two libraries
- MMS ID 991108690000121 Australian journal of botany – which has holdings in three libraries
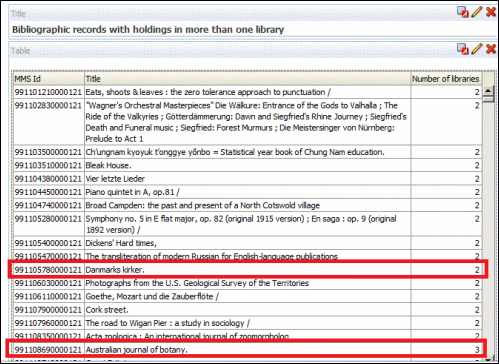 Report ResultsThe following is MMS ID 991105780000121 Danmarks kirker which has holdings in two libraries:
 Danmarks KirkerThe following is MMS ID 991108690000121 Australian journal of botany which has holdings in three libraries:
 Australian Journal of Botany
Conditional Fields
You can use the CASE condition to have an alternate text displayed as a value in an analytics report. The syntax is slightly different if the value is numerical or text. In this example, the CASE condition is used to make the following changes:
- The value for the column Time Loaned, is changed to Not< Loaned if the value is 0 and Loaned if the value is not 0
- The value for the column Publisher is changed to Reidel Publishing if the value is Reidel Pub Co; otherwise, it is not changed
To use the CASE condition:
- Create a report using, for example, the following columns from the Physical Items subject area:
- Bibliographic Details > MMS ID
- Physical Details > Time Loaned
- Bibliographic Details > Publisher
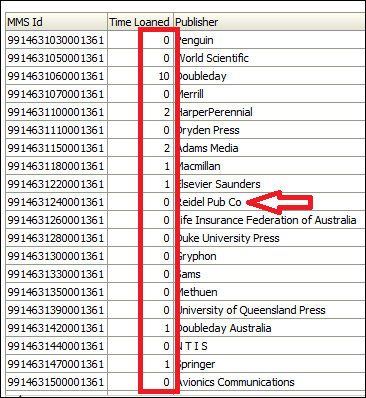 Time Loaned
 - From the Criteria column, select the More Options icon
 of the Time Loaned column and select Edit Formula. The Column Formula dialog box is displayed:
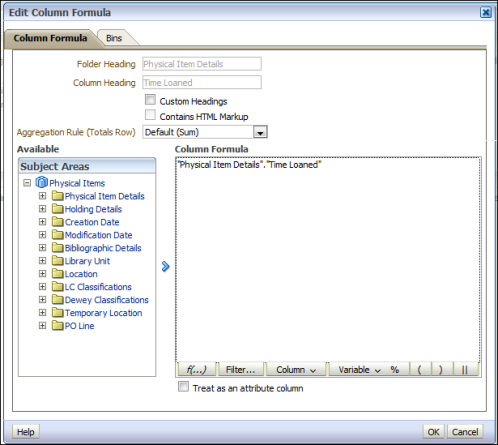 Edit Column Formula – Time Loaned
 - In the Column Formula box, insert one of the following formulas instead of the existing text and change the folder heading, if desired:
- CASE "Physical Item Details"."Time Loaned" WHEN 0 THEN 'Not Loaned' ELSE 'Loaned' END
- CASE WHEN "Physical Item Details"."Time Loaned" = 0 THEN 'Not Loaned' ELSE 'Loaned' END
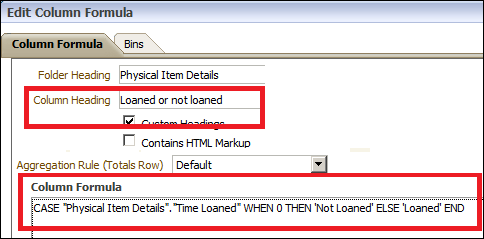 Edit Column Formula for Time Loaned – CASE Condition
 - From the Criteria column, select the More Options icon
 of the Publisher column and select Edit Formula.
 - In the Column Formula box, insert the following formula instead of the existing text and change the folder heading, if desired. (Note the single quotes around the conditional text):
CASE "Bibliographic Details"."Publisher" WHEN 'Reidel Pub Co' THEN 'Reidel Publishing' ELSE "Bibliographic Details"."Publisher" ENDIf you copy and paste the above text, it is recommended to manually retype the single quotes because the Windows copy and paste feature may change them to a different character, resulting in an error message.
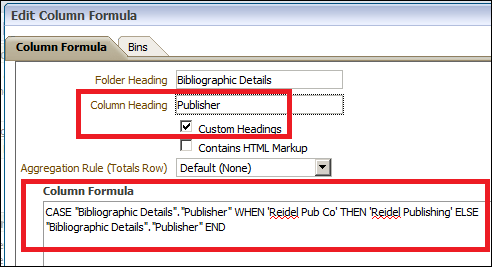 Edit Column Formula for PublisherThe following report displays the changed results:
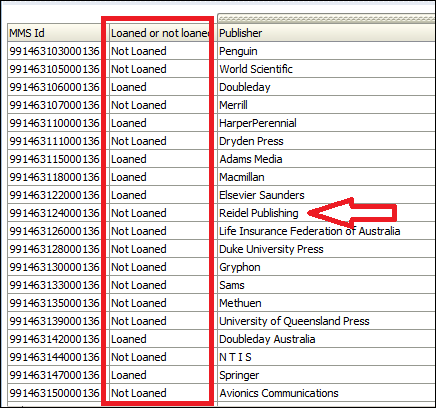 Results With CASE Condition
Conditional Text
You can change the text in an analytics report to be different colors in order to identify different values at a glance. The following report will be used as an example:
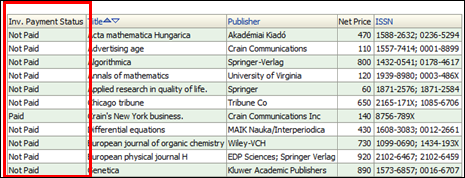
Example Report
To conditionally change the text format in an Analytics report:
- From the Inv. Payment Status field, select the More Options icon
 and select Column Properties:
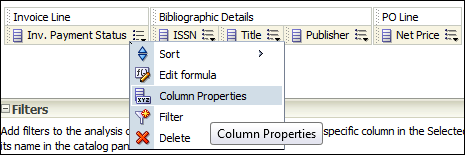 Column PropertiesThe Column Properties dialog box appears.
 Column Properties Dialog Box
 - Select the Conditional Format tab > Add Condition > Inv. Payment Status:
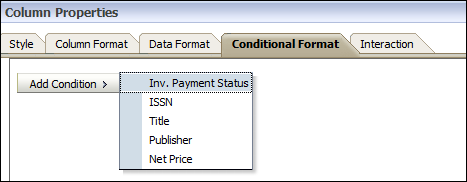 Conditional FormatThe following appears:
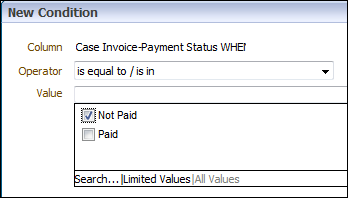 New Condition
 - Select the value whose format you want to change (for example, Not Paid) and select the color that you want the value to be (for example, red):
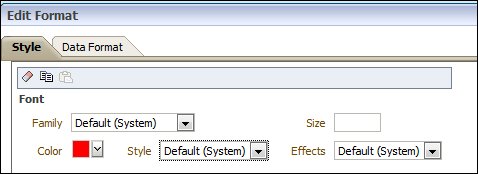 Red Font
 - Do the same for all other values that you want to format with a color:
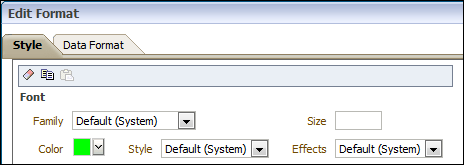 Green FontThe report now appears with the words Not Paid in red and Paid in green:
 Report with Color Formatting
Prompts
You can create an Analytics report with prompts that ask you to select the variables with which to create a report. The report in this example is for loans in Main Library by date and location. You are prompted to enter a date range and location which are used to create the report.
Although there are three kinds of prompts available in analytics reports (column prompt, variable prompt, and image prompt), this example only demonstrates the column prompt.
To create this analytics report:
- From the Analytics dashboard, select New > Analysis and then select Select Subject Area > Fulfillment.
- Select the following columns:
- Loan > Loans
- Item Location > Library Name
- Item Location > Location Name
- From the Location Name field, select the More Options icon
 and select Filter.
 - Filter the results to Library Name is equal to / is in Main Library.
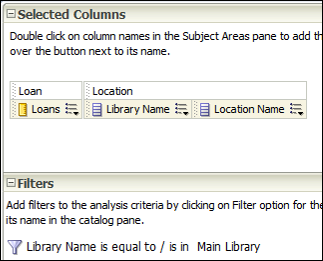 Report CriteriaDo not set filters for the columns that you want to have a prompt.
 - Select the Results tab. The following, for example, is displayed:
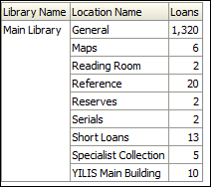 Report Results
 - Select the Prompts tab and then the plus sign to add a new prompt.
 Prompts TabThe following appears:
- Select Column Prompt and Item Location.Location Name. (If you want to select a column not in the report, select More Columns...). The following appears:
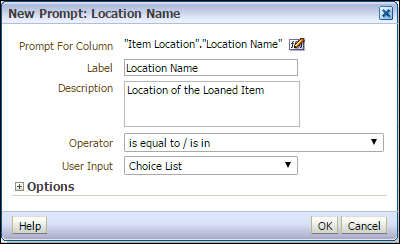 New Prompt: Location Name
 - From the Operator drop-down list, select Is equal to / is in and from the User Input drop-down list, select Choice List.
- Create a prompt for Loan Date:
- Select the plus sign, select More Columns..., and select Loan Date > Loan Date since it is not in the report.
- From the Operator drop-down list, select is between, and from the User Input drop-down list, select Calendar.
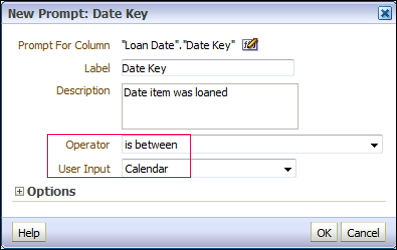 New Prompt: Loan Date
- Run the report by selecting Open (not Edit).
 Run ReportThe prompts appear:
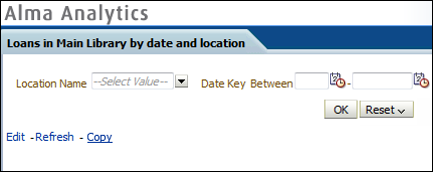 Prompts
 - Fill in the prompts and select OK.
The report is displayed with the criteria you entered at the prompts:
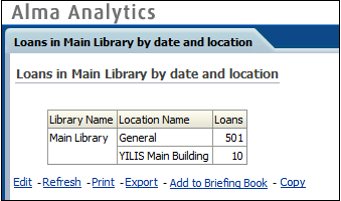 Report
You can add the report to the Analytics menu or the dashboard as a widget and run the report from that location (for more information, see Working with Analytics Objects):
- From the Analytics menu:
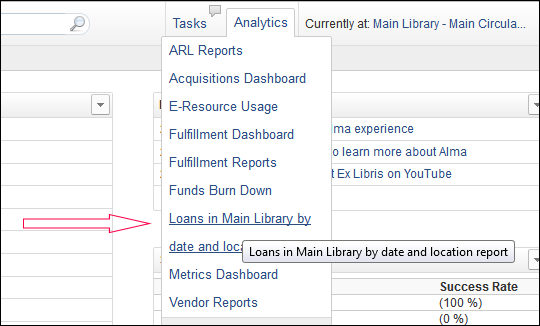 Report in Analytics Menu
 - From the dashboard, select Open in a new window:
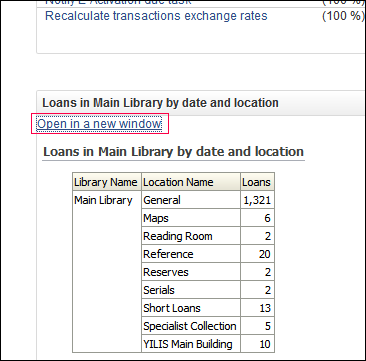 Report in Dashboard
Removing the NULL Value from a Prompt
You can remove the NULL value from the possible values for a prompt.
To remove the NULL value from the possible values for a prompt:
- Select the prompt and select Edit Prompt. The following appears:
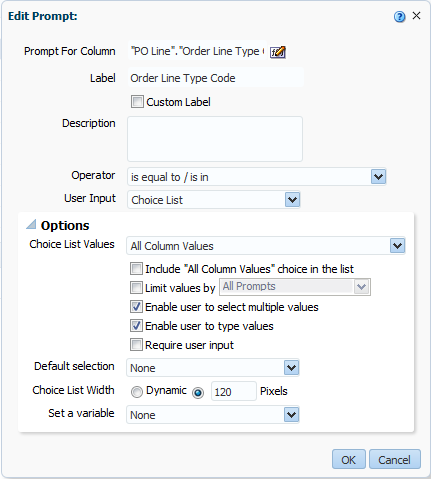 Edit Prompt
 - From the Choice List Values drop-down list, select SQL Results.
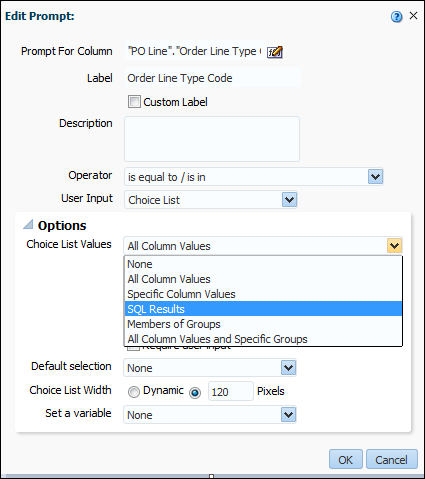 Choice List Values
 - Select OK.
The NULL value does not appear in the list of possible values for the prompt.
Prompts (Dashboard)
You can create a dashboard prompt that allows you to filter the results of a report within a dashboard.
For more information on creating dashboards, see.
There are three steps in creating a prompt in a dashboard:
- Create the prompt.
- Create a report that will use the prompt.
- Create a dashboard and associate the prompt and the report to it.
To create a prompt in a dashboard:
- Create the prompt.
- Select New > Dashboard Prompt > Borrowing Requests.
- Select the New icon and select Column Prompt.
- Select Bibliographic Details > Material Type and select OK.
- Select the options you want and select OK.
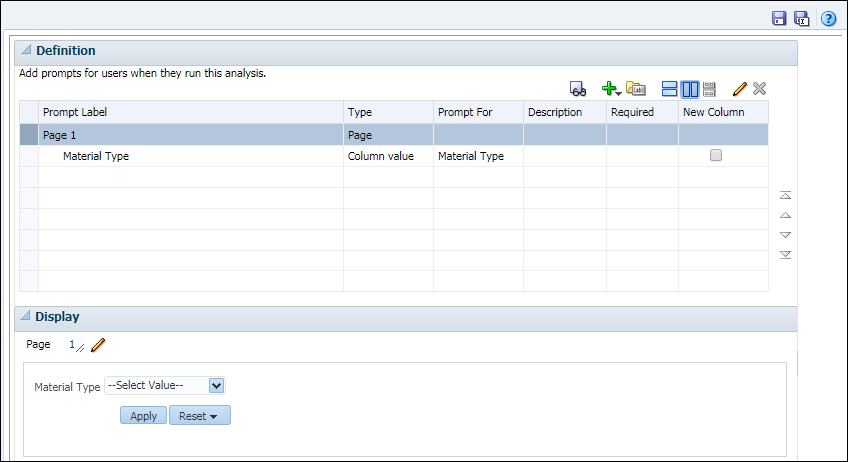 New Dashboard Prompt
 - Save the prompt.
- Create a report that will use the prompt.
- Select New > Analysis.
- Create a report with the Borrowing Request Details > Number of Requests and Bibliographic Details > Material Type fields.
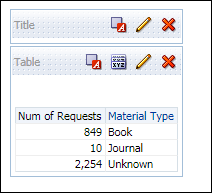 Material Type Report
 - Add the is prompted filter to the Material Type field.
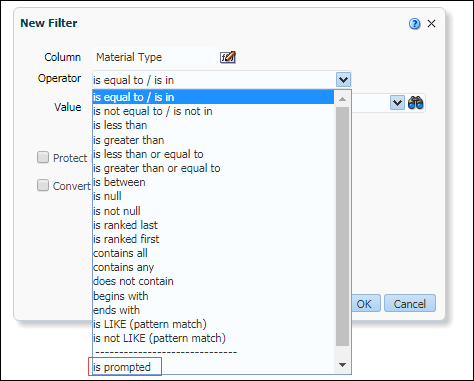 Is Prompted
 - Save the report.
- Create a dashboard and associate the prompt and the report to it.
- Select New > Dashboard > Edit.
- From the left pane, select the report and prompt you created.
The dashboard shows the report and the prompt that can be used to filter the report.
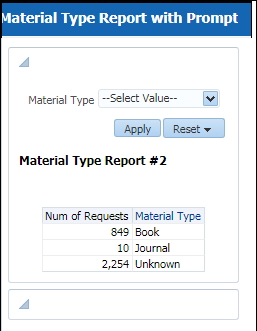 Dashboard with Prompt
 - Save the dashboard.
Using Report Output as Input Data
It can be useful to take the output of one report and use it as input in another report. For example, a report in one subject area can be used as input for a report in a different subject area. This provides a means of combining the dimensions of various subject areas together in one report.
For example, you want to determine the effectiveness of a fund by checking the fund for the number of loans per item according to several criteria, such as arrival date and vendor.
In the Physical Items subject area, you can get a list of items and the number of loans per item for the criteria. However, the Physical Items subject area does not have a Fund field, so you cannot get a list of loans by fund from which the item was ordered.
On the other hand, in the Funds Expenditures subject area there is a Fund field, but there is no Number of Loans field.
To get the data you want, you first make a report of the PO Line reference (order line number) using the Funds Expenditures subject area and then use the results from that report as input in a second report with the Physical Items subject area. This is done using the is based on the results of another analysis filter.
To use the output of an analytics report as the input for another report:
- Create a report with the Fund Expenditure > Fund Ledger > PO Line Reference field.
- Apply the following filters:
- Set the fund ledger name to Library and Information Science.
- Set the PO line sent date to be within the last year.
- Set the receiving status to be yes.
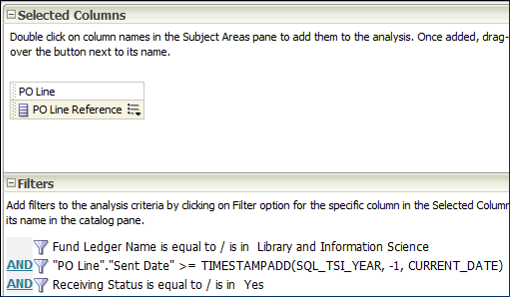 PO Line Reference Field with FiltersThe following is an example of the report:
 PO Line Reference Report
 - Create a report with the Physical Items > PO Line > PO Line Reference field.
- Select the following filters in the New Filter dialog box:
- Operator – is based on results of another analysis filter.
- Saved Analysis – select the report you made with the Fund Expenditure subject area
- Relationship – set to is equal to any
- Use Values in Column – PO Line Reference
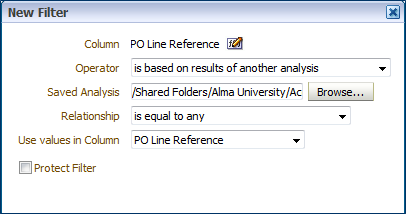 FilterThese settings filter the results by PO Line Reference Number based on the fund, so that the report displays the number of loans for each PO Line Reference based on the fund even though the Fund field is not in the Physical Items subject area. The following are the criteria of the report:
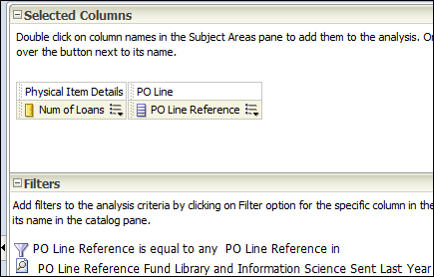 \PO Line Reference Filtered By Fund
The following is an example of the report:
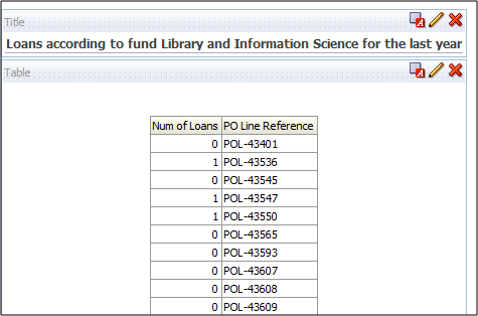
PO Line Reference Filtered By Fund – Report
Instead of just a list of the PO Line Reference Numbers and an indication of how many times items from that PO Line were loaned you may want an indication of how many total items were ordered from that fund for the given time period. This indicates how many of these items were loaned.
If the number is relatively small you can conclude that this fund is not being used effectively. Alternatively, if there is a high number of loans for items from this fund, you can conclude that this fund is being used effectively.
To create the report:
- Create a report using the following criteria:
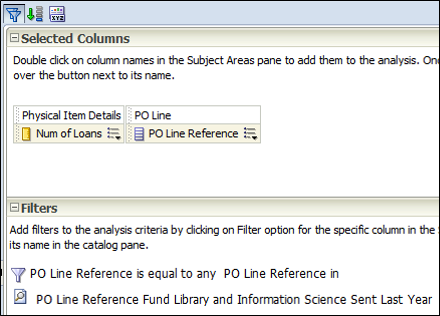 Report Criteria
 - Remove the PO Line Reference field and add two more fields, such as the Num of Loans field. These fields are just placeholders and will be renamed.
- Use the Edit formula function to change the three fields to the following:
- First field:
- Column Header: Items Not Loaned
- Formula: FILTER("Physical Item Details"."Num of Items" USING ("Physical Item Details"."Last Loan Date" IS NULL))
- Second field:
- Column Header: Items Loaned
- Formula: FILTER("Physical Item Details"."Num of Items" USING ("Physical Item Details"."Last Loan Date" IS NOT NULL))
- Third field:
- Column Header: Total Items
- Formula: "Physical Item Details"."Num of Items"
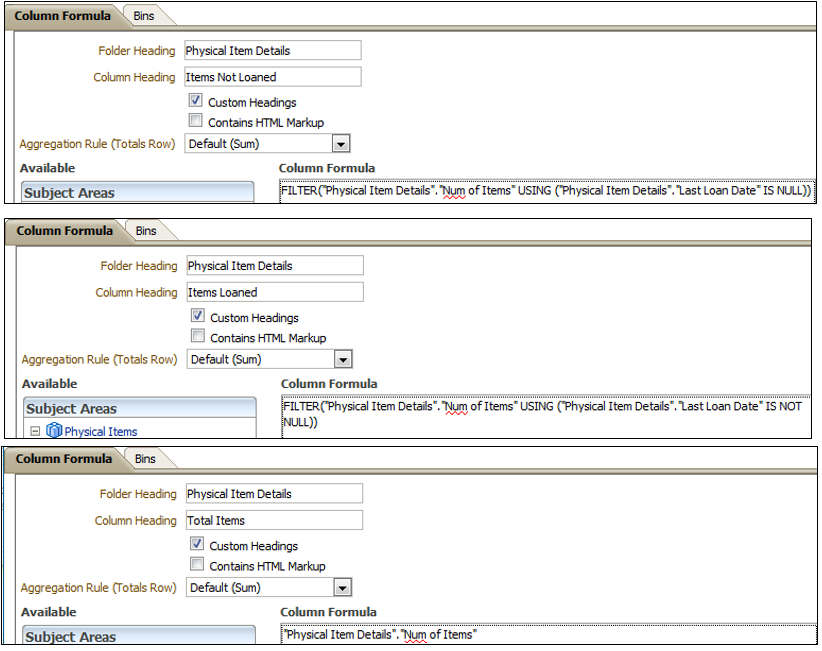 Column Formula
 - First field:
The following is an example of the report:

Loans According to Fund Report
You can add a graph to the report:
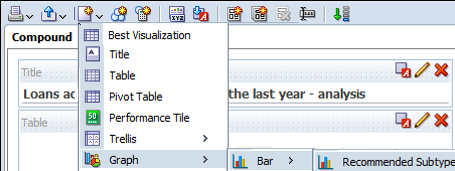
Graph
The following is an example of the graph:
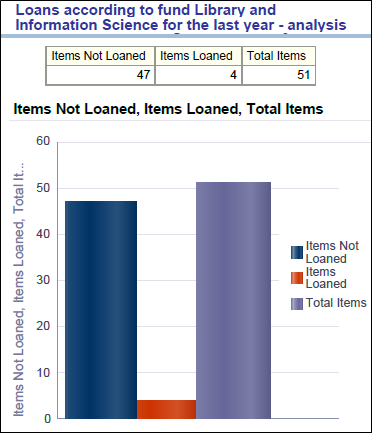
Graph Example
The graph illustrates that the fund is not very effective. Only 4 out of a total of 51 items ordered in the last year have been loaned.
To see the total percentage of items loaned out of all the items ordered, use the following filter to divide the total amount of items loaned by the total amount of items ordered and them multiply by 100:
(FILTER("Physical Item Details"."Num of Items" USING ("Physical Item Details"."Last Loan Date" IS NOT NULL)) / "Physical Item Details"."Num of Items") * 100
For example:
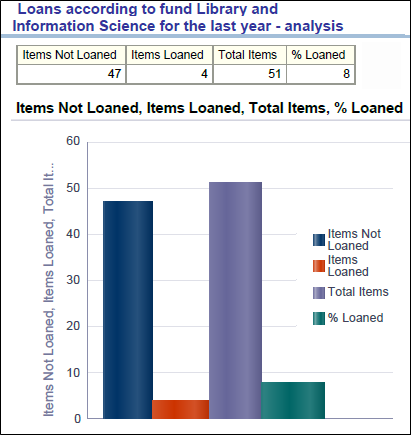
Bar Graph with Percentage Example
Combined Reports
This section describes how to union two reports by using a placeholder column. In the following example, the report shows all portfolios that are not available, as well as title, collection name, and PO line reference. The report shows both rows that have values for PO Line Reference as well as rows that have null values for PO Line Reference.
When combining two reports using union, the numbers of columns, data types, and filters must be the same.
To combine two reports using union to display null values:
- Create a report with the following fields and filters:
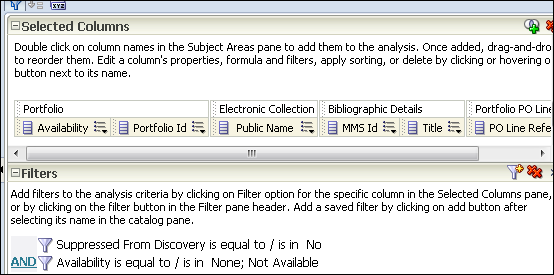 Report Columns and Filters
 - In the Criteria tab, select the combine sets icon and select the subject area of the original report (in this example – E-Inventory).
 Combine Sets
 - Select the arrow to check that Union is selected.
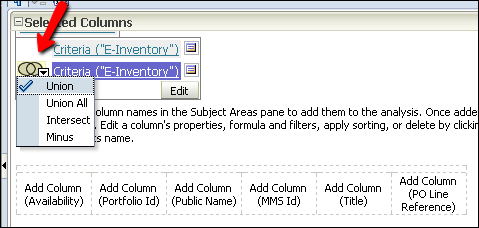 Union
Union - In the left panel, find the exact same column for each column in the report, and double select it. This puts the column in the union report. Do this for all of the columns, except for PO Line Reference.
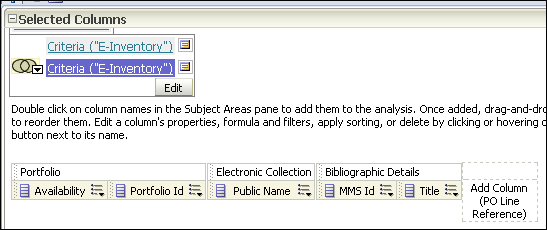 Union Report Columns
 - For the PO Line Reference column, select any column from the left panel, and double select it. In this example, the ISBN column is used.
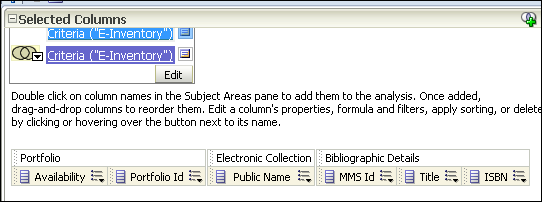 ISBN Column
 - For the ISBN column, select Edit Formula, and enter 0. Select OK.
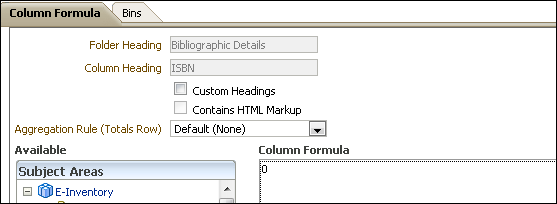 Column Formula 0The PO Line Reference column is now substituted with a 0.
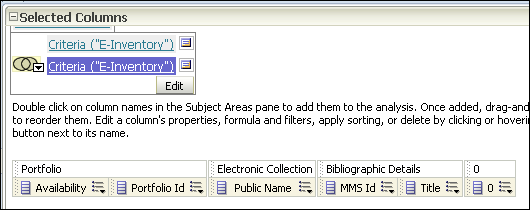 PO Line Reference Now 0
 - Using the filter pane, add the two filters that are in the original report.
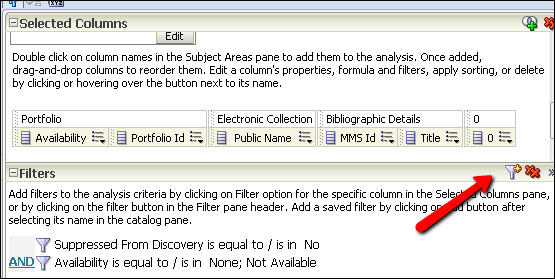 Add Two Filters
 - Select the Results tab to view the resulted report. The rows that do not have a value now appear with a 0.
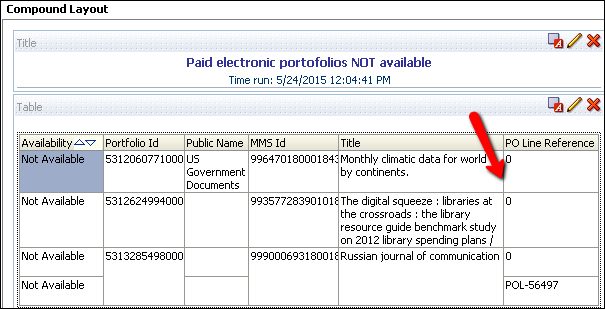 Rows Appear with Zero
 - Edit the formula again in the Criteria tab, using null instead of 0. The rows with no PO line reference are blank.
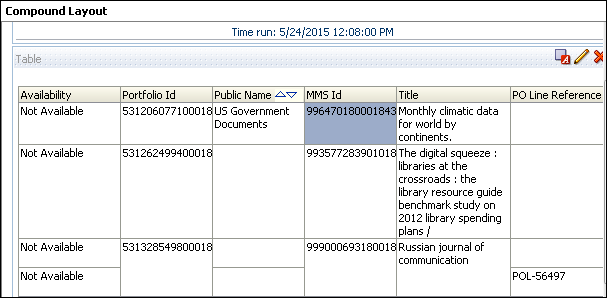 Rows Appear Blank
Select any of the links (not the Edit button) in the criteria tab to edit the reports.
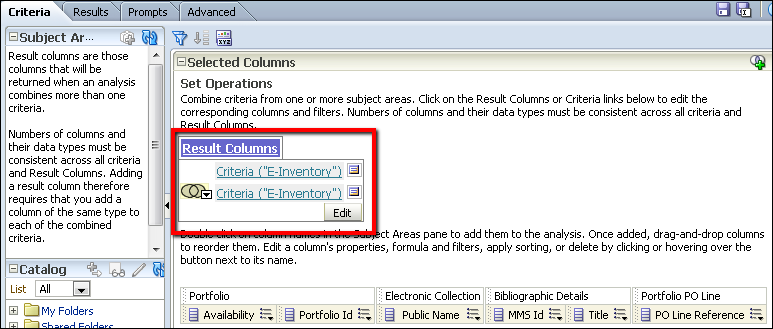
Edit Reports
Select Result Columns to sort the columns.

Sort Reports
The following is a report sorted by title:
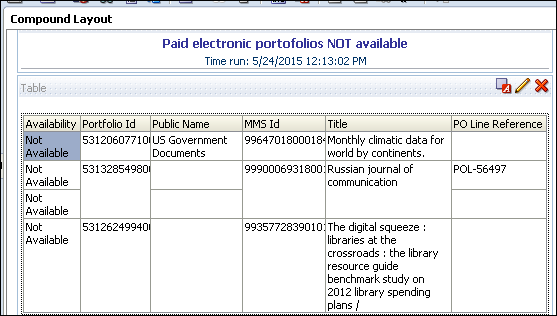
Sorted by Title
Filtering Procedures
For more information on using relative date filters in Analytics, see Analytics - Relative Date Filters in Analytics.
Relative Dates
This section describes how to filter an Analytics report by a date that is non-fixed, such as “greater than 7 days ago” or “sometime this year”. This is useful if you want a report of orders made in the last week or the number of items loaned in the current year. There are several ways to create such filters. This section describes one way of doing this and presents four examples.
To filter by non-fixed dates in an Analytics report:
- From Analytics, select New > Analysis and then select Select Subject Area > Fulfillment.
- Create a report with the following columns, for example:
- Loan > Loans
- Loan > Renewals
- Loan Date > Loan Date
The following examples describe several ways of filtering the results by a date that is non-fixed:
Example 1 – The Last Seven Days
The report displays any items loaned within the last seven days.
To display any items loaned within the last seven days:
- From the Loan Date field, select the More Options icon
 and select Filter.
 - Select Convert this filter to SQL.
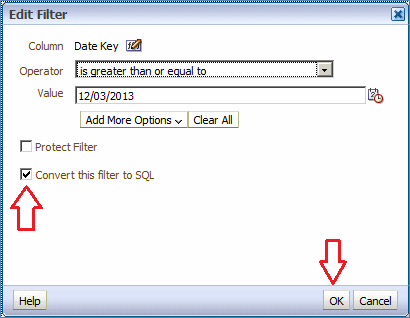 Edit Filter
 - Select OK. The following is displayed:
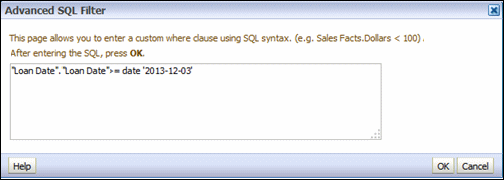 Advanced SQL Filter
 - Change the text from:
"Loan Date"."Loan Date" >= date '2013-12-03'To:"Loan Date"."Loan Date" >= TIMESTAMPADD(SQL_TSI_DAY, -7, CURRENT_DATE)The text now appears as follows:
 Advanced SQL Filter
 - Select OK. The filter appears as follows:
 Filters
 - Select the Results tab to view the report. The report includes results from Dec. 03, 2013:
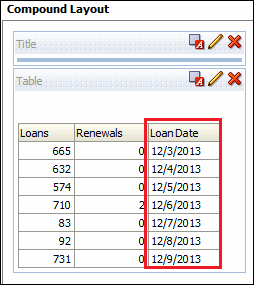 Compound Layout
Example 2 – The Current Month
The report displays any items loaned in the current month.
To displays any items loaned in the current month:
- Select the Edit icon
 in the filter pane of example #1.
 Edit Filter
 - Change the text to:
Loan Date"."Loan Month Key" = MONTH(CURRENT_DATE)
 Advanced SQL FilterThe retrieval is by “Loan Date”.Loan Month Key” and not “Loan Date”.”Loan Date”.
 - This syntax includes all dates in December for every year. Add additional retrieval for the current year using the loan year:
"Loan Date"."Loan Year" = YEAR(CURRENT_DATE)The filter appears as follows:
 FiltersThe report now includes results from the current month (December) and the current year (2013):
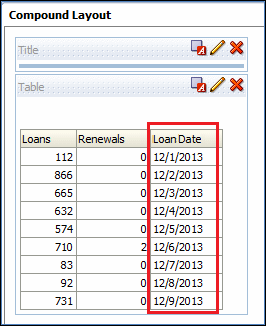 Compound Layout
Example 3 – The Current Year
The report displays results from the current year (for example, 2013).
To display results from the current year:
- Change the SQL filter from the previous example to the following:
"Loan Date"." Loan Year" = YEAR(CURRENT_DATE)
- Select the Results tab to display the report:
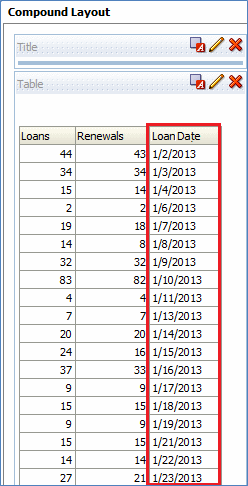 Compound Layout
Example 4 – The Last Year
The report displays results from the last year (the last 365 days).
- Change the SQL filter from the previous example to the following:
"Loan Date"."Loan Date" >= TIMESTAMPADD(SQL_TSI_YEAR, -1, CURRENT_DATE)The filter appears as follows:
 Filters
 - Select the Results tab to view the report:
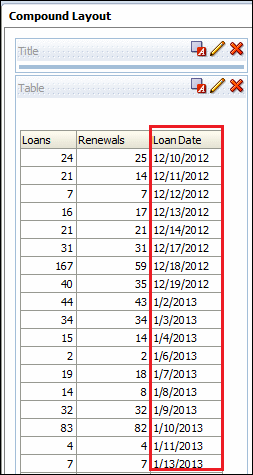 Compound Layout
Items Returned 30 Days or More After Their Due Date
Use the Loan > Return Due Days field of the Fulfillment subject area to create this report. This field displays the difference between the due date and the return date. If it is a positive number, the book was returned after the due date. If it is a negative number, the item was returned before the due date.
You can also use the out-of-the-box report Ex Libris - Items returned 30 or more days after due date (Late Returns) located under shared/Community/Reports/Shared Reports/Reports/Fulfillment - Misc. reports.
To create this analytics report:
- From the Analytics dashboard, select New > Analysis and then select Select Subject Area > Fulfillment.
- Select the following columns:
- Loan > Return Due Days
- Loan Date > Loan Date
- Due Date > Due Date
- Return Date > Return Date
- Loan Details > Barcode
 Return Due Days
 - From the Return Due Days field, select the More Options icon
 and select Filter.
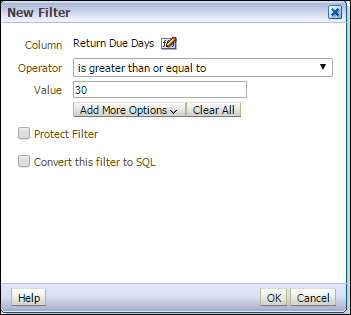 Return Due Days Filter
 - From the Operator drop-down list, select is greater than or equal to.
- In the Value field, enter 30.
- Select OK.
- Select the Results tab.
A report appears with the items returned 30 days or more after their due date:
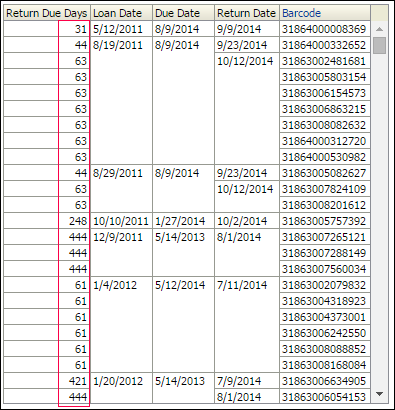 Return Due Days Report
Patrons with Expiration Dates Within One Week Who Have Active Loans
You can create a report that shows patrons with an expiration date within one week of the present who have active loans.
To create this analytics report:
- From the Analytics dashboard, select New > Analysis and then select Select Subject Area > Fulfillment.
- Select the following columns:
- Borrower Details > Expiry Date
- Borrower Details > Primary Identifier
- Borrower Details > First Name
- Borrower Details > Last Name
 Selected Columns
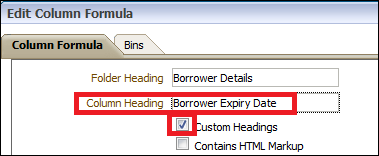
 - To make the heading clearer, rename Expiry Date to Borrower Expiry Date.
- Select the More Options icon
 next to Expiry Date and select Edit Formula.
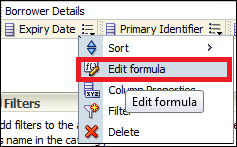
- Select the Custom Headings check box and enter Borrower Expiry Date in the Column Heading field.
- Select OK.
 Borrower Expiry Date
- Select the More Options icon
- Create an SQL TIMESTAMPADD filter on Borrower Details.Expiry Date using TIMESTAMPADD.
- From the Borrower Details field, select the More Options icon
 and select Filter.
 - Select Convert this filter to SQL.
- Select OK.
- Change the text to:
"Borrower Details"."Expiry Date" BETWEEN (CURRENT_DATE) AND TIMESTAMPADD(SQL_TSI_WEEK, +1, CURRENT_DATE)
- Select OK.
- From the Borrower Details field, select the More Options icon
- Select the Filter icon
 and select More Columns....
 - Select Loan Details > Loan Status and select OK.
- Set the Operator to is equal to/is in and the Value to Active.
 FilterThe following is an example report:
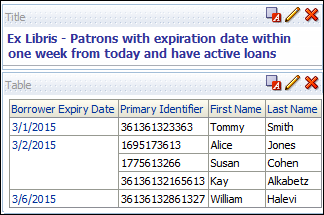 Report
 - To improve readability, have the Borrower Expiry Date appear on each row:
- Select the Edit icon
 .
. - Select the Table Content Properties icon
 .
. - Under Row Styling, select Enable alternate styling and Repeat Cell Values.
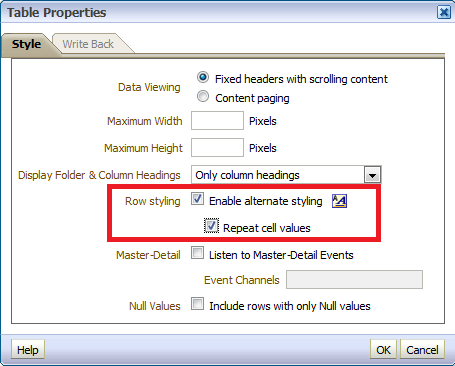 Table Properties
- Select the Edit icon
- Select OK.
The report appears with the Borrower Expiry Date on each row:
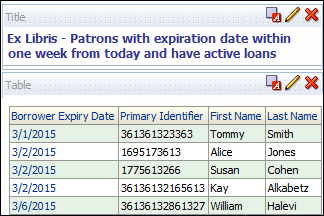 Report with Borrower Expiry Date on Each Row
Case-Insensititve Filtering
You may want to filter a report by title starting with both an uppercase and a lowercase letter. One way to do this is to create two separate filters - one for uppercase and one for lowercase. This section describes how one filter can be created to achieve this.
To filter by a string for both uppercase and lowercase with one filter:
- Select Edit Formula for the field you want to filter, for example, Title.
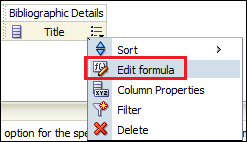 Edit Formula
 - Change the column Heading to Lower Case Title.
- In the Column Formula field, add Lower to the formula.
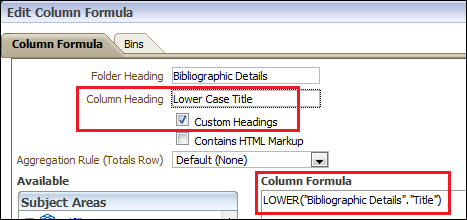 Lowercase Title
 - Filter by feminism (with a lowercase f), for example, on Lower Case Title. The report displays records whose title has either Feminism or feminism.
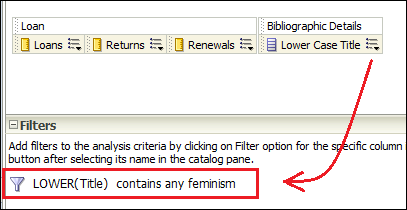 Filter for FeminismThe following is an example of a report. However, all of the titles are in lowercase.
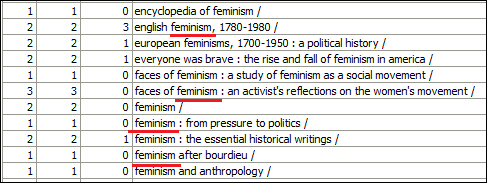 Lowercase ReportYou want to display the real title and filter by the lowercase title.
 - Add the real title to the report, and delete Lower Case Title from the display, but leave it in the filter.
 Delete from DisplayThe criteria now look like the following:
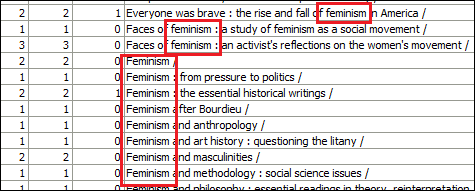
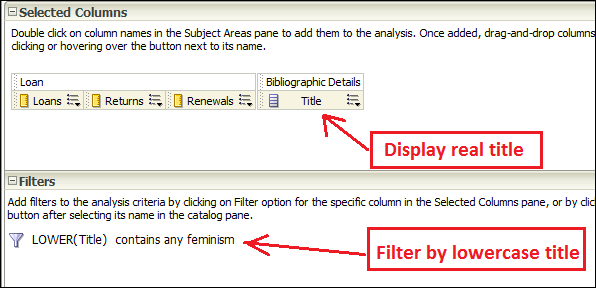 CriteriaThe following is the report displaying results in both uppercase and lowercase.
 Uppercase and Lowercase Report
Column-Specific Filtering
For information on using multiple filters for each column in an Analytics report, see Analytics - How to use multiple filters per column in an analytics report.

