
E-Resources
|
General
What reporting options are available related to e-inventory?
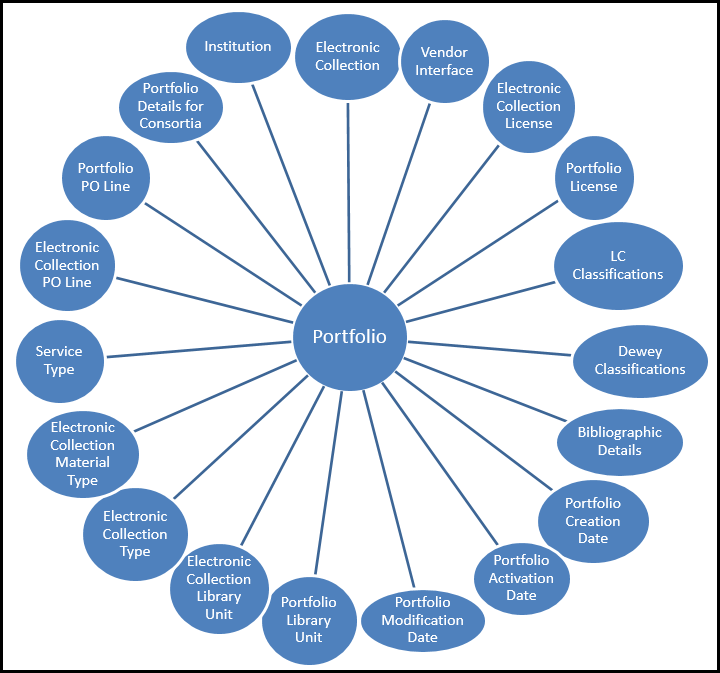
Using the E-Inventory subject area, the Design Analytics user may create reports and dashboards for the E-Inventory area. The following are examples of business questions that may be answered via the E-Inventory subject area:
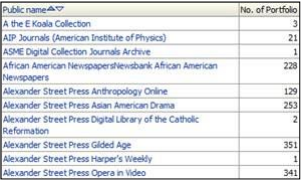
- Electronic Collection List - Drill down to Portfolio list in each electronic collection
- Number of portfolio per classification (Dewey, LC)
Usage, cost per use
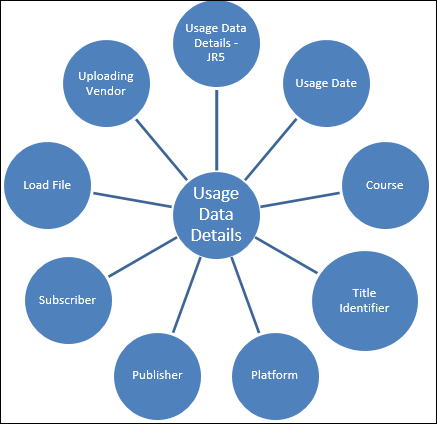
Can Alma generate reports related to usage statistics?
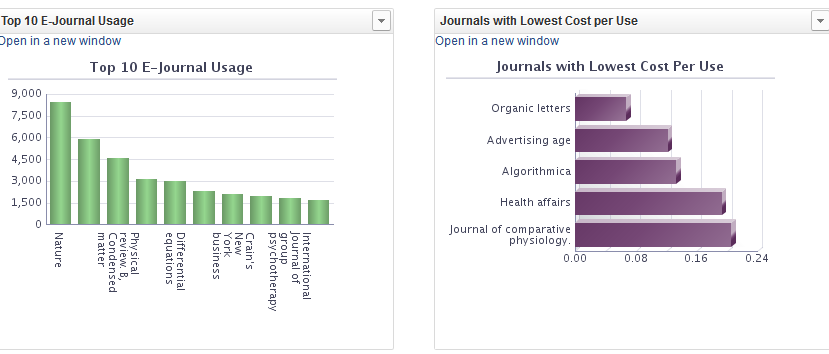
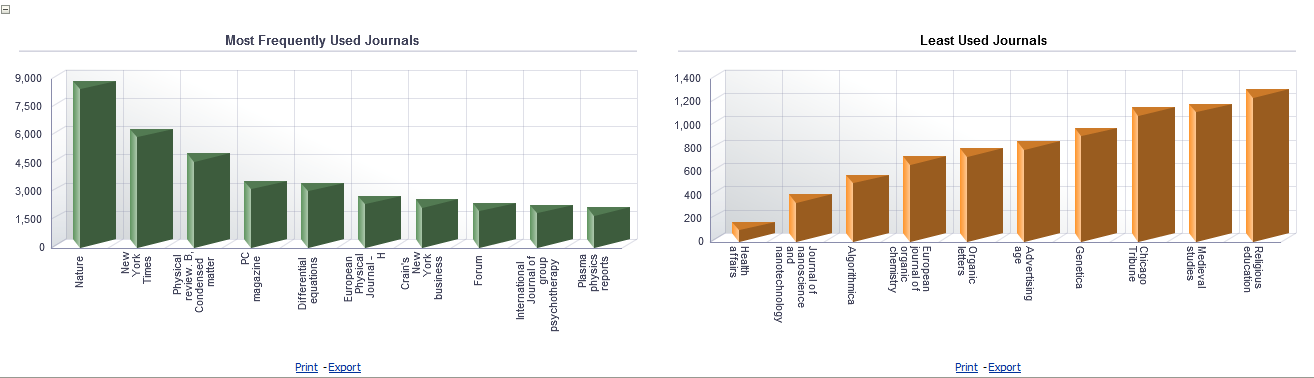
The Usage Data subject area is able to answer the following types of business questions:
- Most frequently used journals
- Annual journal usage trend.
- Total and monthly number of successful requests per each journal
- Database Usage - Annual Trend
- Most Frequently Used Databases
- Total number of searches and sessions per each database and the monthly/yearly search statistics

- Most frequently used journals, databases and electronic books
- Trends in usage of these electronic resources
- Number of successful requests per resource, publisher and platform
- Total number of searches and sessions
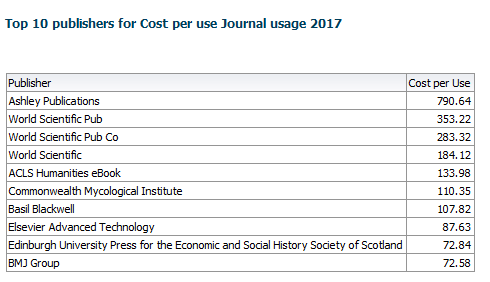
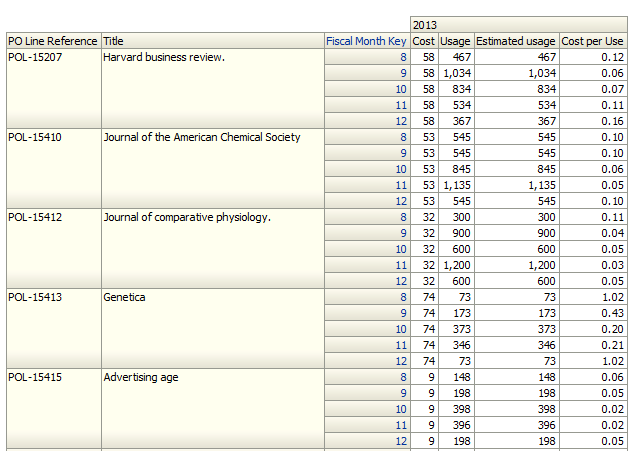
- Examples of report outputs (including cost per use):
Can a report of cost per use by publisher be created ?
This can be achieved using the Cost Usage subject area. An example of such a report can be seen in the following screen capture:
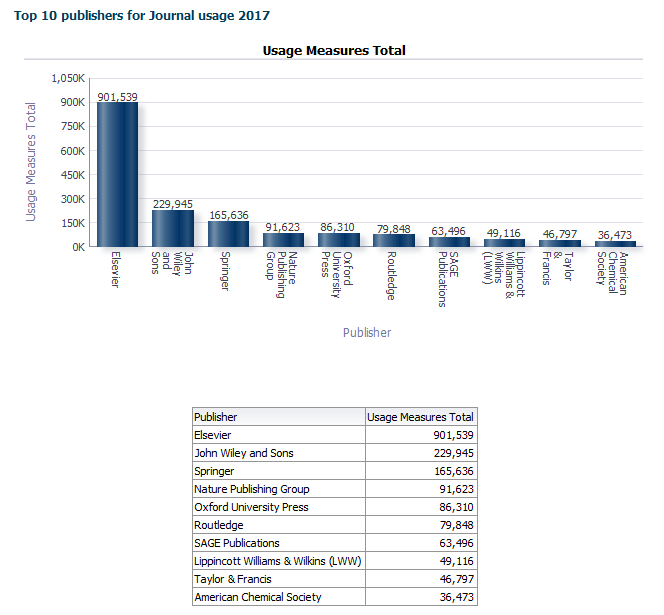
Can a report of usage per publisher be created?
This can be achieved using the Usage subject area. An example of such a report can be seen in the following screen capture:
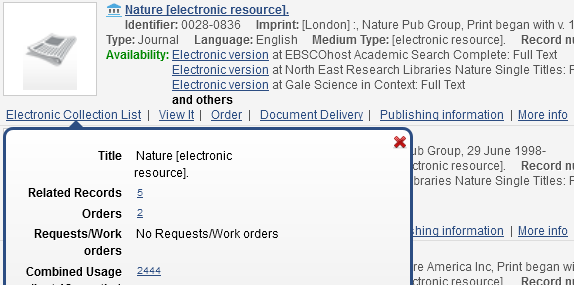
Can usage statistics be viewed from within Alma?
Is it possible to generate reports and statistics related to cost per use?
- Cost per Use – Condition Most Expensive
- Cost per Use Journal Details
- Cost per Use Package Details
- Least Expensive Journals
- Least Expensive Packages
- Most Expensive Journals
- Most Expensive Packages
- Package Cost per Use – Annual Trends
- Title Cost per Use – Annual Trends
Link Resolver
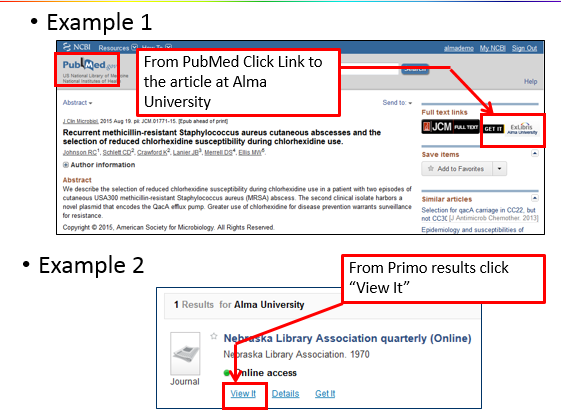
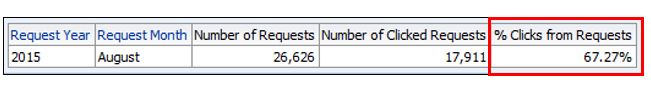
Can reports related to link resolver usage be created?


- If a user clicks a link to the Alma Link resolver from an external source such as PubMed or a vendor native interface
- If a user clicks “View It” from the Primo search results for an electronic resource:
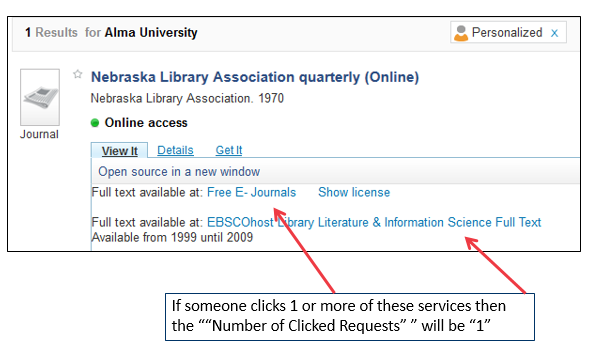
-
‘0’ means no services were clicked
-
‘1’ means that at least 1 service was clicked.
-
The “View It” tab within Primo
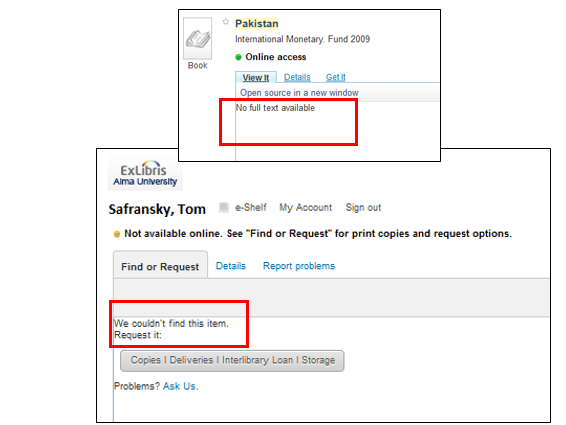
-
The electronic services page after clicking from another source

-
A comparison of Number of clicked requests in the last year for collections covering a particular subject area. The library can identify which source is most used and might choose therefore to cancel the least used collection.
-
A report of the top ten ‘Number of requests without services” and the corresponding classification no. The library can identify searches made by patrons but there have not been full text services. Based on the report output the library might want to consider changing the collection development policy and purchasing more resources in these areas.
-
A report of the top ten ‘Number of clicked requests’ and the corresponding classification no. The library can identify searches made by patrons with a click through for services. Based on the result, he library might want to consider continuing to purchase resources in these areas because they are being used.
Does the link resolver subject area also support reporting on digital usage?
The following fields are available in the Open URL Context Measures dimension of the Link Resolver Usage subject area in order to support the reporting of digital usage:
- Number of Digital Services – the number of digital representations that appear when a user clicks View It
- Number of Electronic Services – the number of electronic services that appear when a user clicks View It
- Number of Digital Clicked Services – the number of digital representations a user clicks from the View It menu
- Number of Electronic Clicked Services – the number of electronic services a user clicks from the View It menu

Licenses
Does Alma support reporting on licenses?
Using the Licenses subject area, the staff user can create reports/dashboards relating to licenses and answer the following types of business questions:
- What is the number of portfolios and collections per license?
- What are the total expenditures for PO lines with specific licenses for specific fiscal years?
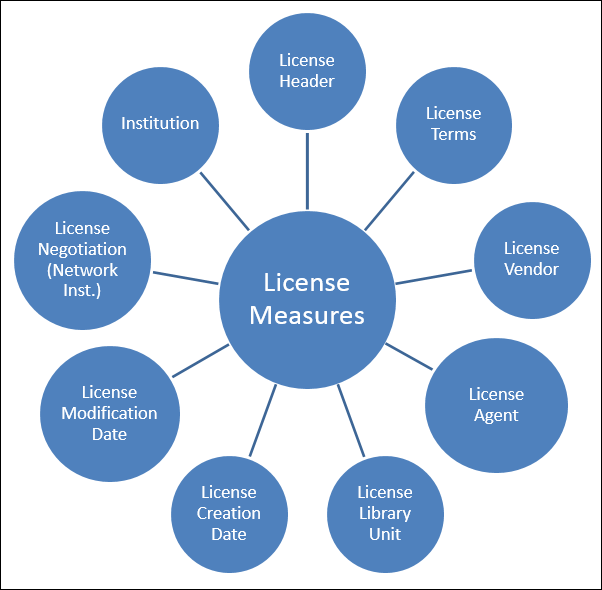
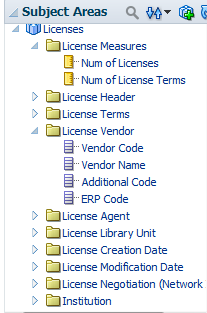
The following folders and fields are available in the Licenses subject area:
Total views:
4887