
Intota Assessment: Build Your Own Reports
- Product: Intota Assessment
I want a report that I cannot generate by customizing an existing 360 COUNTER report or Library Report in Intota Assessment, is there a way to create a custom report from scratch?
Intota Assessment's customization tool lets you create custom usage reports that do not exist amongst the 360 COUNTER eResource reports and the Library Reports (Print reports) listed on Intota Assessment's Reports page.
Built on the Oracle Business Intelligence platform that supports Intota Assessment, the Build Your Own Reports tool is designed to be a back-end reporting tool for advanced, technically-savvy and/or development-level Oracle users.
The Build Your Own Reports tool functions include:
Built on the Oracle Business Intelligence platform that supports Intota Assessment, the Build Your Own Reports tool is designed to be a back-end reporting tool for advanced, technically-savvy and/or development-level Oracle users.
The Build Your Own Reports tool functions include:
- Create and edit customized reports
- Display the data in graphical representations such as bar graphs and pie charts
- Create formulas and filters, and apply formatting
- Schedule custom reports to be sent to yourself and others
The rest of this document covers the below topics. Click a link to jump to the section you want to read:
- How to create a drop-down list of values from which the user makes a selection and the report is ran.
- How to display the report as a graph.
Schedule a Custom Report (See Intota Assessment: Build Your Own Reports: Schedule a Report to be Delivered Automatically)
Accessing the Customization Tool
From the Reports page in Intota Assessment, click the Customization link on the right side of the page.
When viewing the Customization Home Page, the important tools are 1) the left side menu and 2) the Catalog link on the blue toolbar:
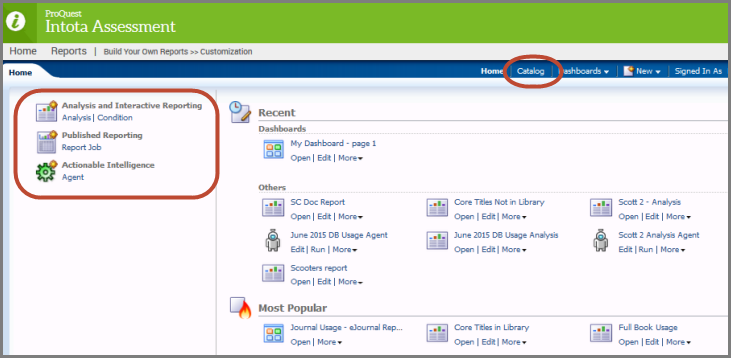
Note that the Recent and Most Popular sections of the above Customization Home Page currently do not provide relevant reports for your institution, so for the time being, the relevant tools are the two highlighted areas above.
Left Side Menu
The left side menu shown above provides the primary tools currently available in the Build Your Own Reports area of Intota Assessment: - Analysis and Interactive Reporting: Click the Analysis link to start building your custom report.
- Currently the other two options (Published Reporting and Actionable Intelligence) support the ability to automate running and distributing a custom report, however for the time being this functionality is handled more effectively by scheduling a report when you are viewing the report. See Intota Assessment: Build Your Own Reports: Schedule a Report to be Delivered Automatically
Catalog
When you click the Catalog link shown above, you are taken to the Catalog page where the left side contains your Library folder where you can access saved, custom reports. Note that currently your Library folder is the one relevant aspect of the Catalog page; the other folders, along with the Tasks in the lower left area of the page and the Reports along the right side of the page, currently are not accessible: 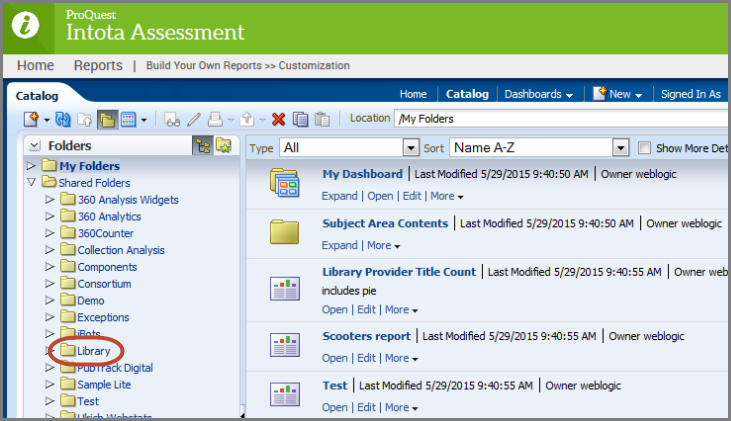
Build a Custom Report: The Basics
Follow the steps below to create a custom report.
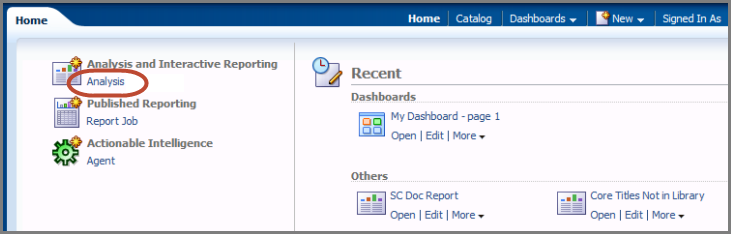
1. Click the Analysis link that displays on the left side of the customization home page. Analysis is Oracle's term for Report.
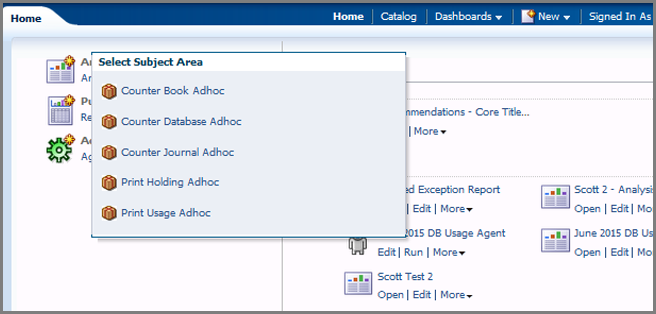
2. Select the Subject Area
You can build your report from one of five collection areas:
- Counter Book Adhoc for eBook reports
- Counter Database Adhoc for database reports
- Counter Journal Adhoc for eJournal reports
- Print Holding Adhoc for your print collection
- Print Usage Adhoc for your print collection, limited to titles that have circulated
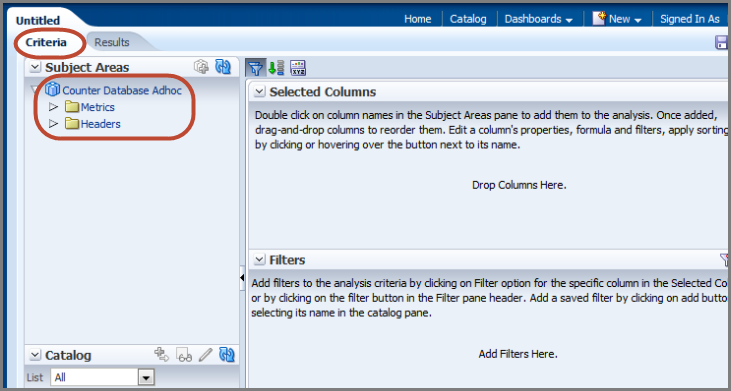
After selecting a subject area, you are taken to the Criteria tab within the Analysis Editor where you build the Metrics and Headers for your report.
- Metrics are numeric values that can be calculated
- Headers are non-numeric values that can be counted. Titles are a good example of a Header.
In many reports (such as the below Counter Database Adhoc report), you are presented with two folders (Metrics and Headers). Some reports (such as Print reports) instead display both Metrics and Headers combined together in folders.
3. Set up Metrics and Headers
To add a Metric or Header to your report (metrics and headers are defined in Step 2 above), double click on the item and it will then display in the Selected Columns area on the right side of the screen.
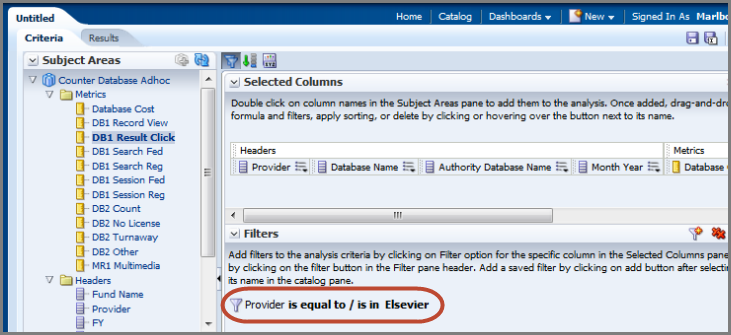
- To filter a Metric or Header so that particular values display in the report, click the below icon that displays to the right of the Metric or Header, and select Filter.
- When you select Filter from the drop-down menu, the New Filter window opens. Select an Operator and a Value and the filter will display in the Filters area on the right side of the screen. In the below example I selected the Operator is equal to / is in and I entered the Value Elsevier, and now the Filters area on the Criteria tab displays the filter.
You can remove a Metric or Header from your report by selecting Delete from the same drop-down menu above that includes the Filter option.
Note that a Metric or Header can be set up so that the user is prompted to select a value before the report is ran. Such configuration is done outside of the Criteria tab. See the FAQs (Frequently Asked Questions) section below.
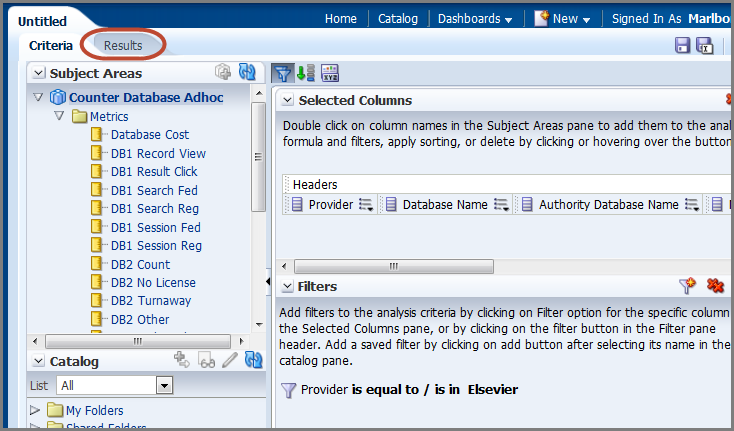
4. View your report
At anytime when you have Metric(s) and/or Header(s) in the Selected Columns area on the right side of the screen, you can run the report by clicking on the Results tab next to the Criteria tab. The report will generate and you can get a sense of how it is currently looking. From the Reports tab, you can always click back to the Criteria tab and continue configuring your report.
To re-order the Metrics and Headers, drag and drop a Metric or Header to the desired location.
Note that while the Results tab provides an option to schedule the report for automated delivery, currently the best practice is to schedule a report once the report has been created and saved. See Intota Assessment: Build Your Own Reports: Schedule a Report to be Delivered Automatically
5. Save, Print and Export options
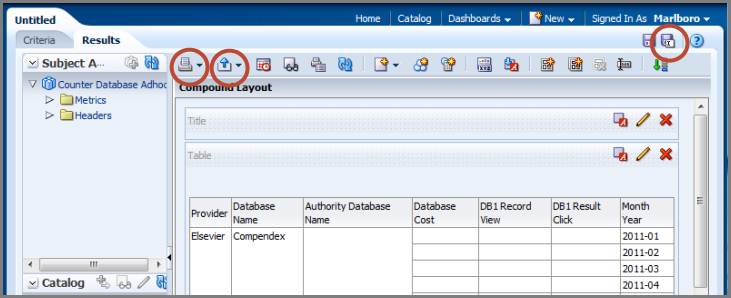
When you are viewing the report on the Results tab, you can save the report to your Library folder in Intota Assessment by clicking the Save As button in the top right of the screen (see the last screenshot below).
- Make sure you save the report to the Library folder; you may need to navigate to the Library folder listed under Shared Folders.
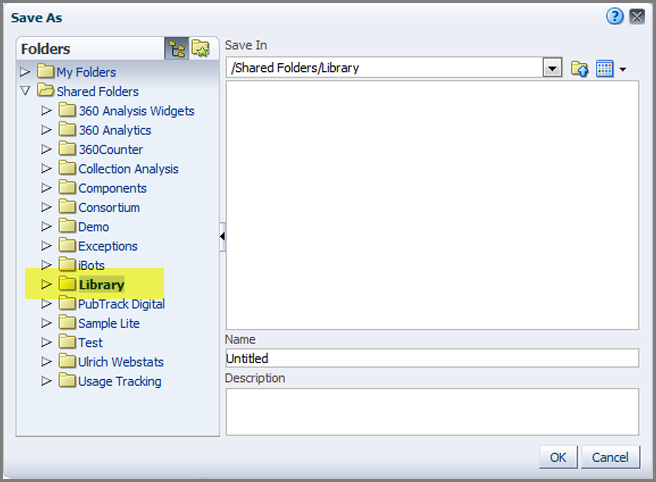
Note that currently the Library folder is the one folder available to you and others at your institution who have access to Intota Assessment. At this time Intota Assessment is unable to provide a unique folder for reports accessible to you and only you.
To print the report click the left side button highlighted below; to export as PDF, Excel, PowerPoint, CSV, Tab Delimited or XML, click to the export button to the right of the print button.
Save As, Print, and Export buttons:
FAQs (Frequently Asked Questions)
The Build Your Own Reports tool offers a wide variety of features and functionality. This section will continue to expand as we see what aspects libraries are interested in.
Question:
I want my custom report to be ran based on a drop-down list of values for a Metric or Header, from which the user makes a selection and the report is ran. How do I do this?
Answer:
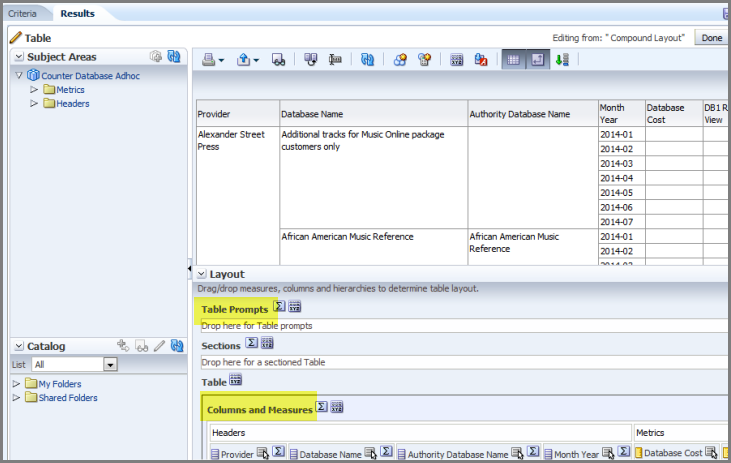
The Results tab (not the Criteria tab) is where you can configure a Metric or Header so that it provides the user with a drop-down list of values. When viewing the report on the Results tab, click the Edit View icon for the report table:
In the Layout section at the bottom of the screen, the Metrics and Headers for the report are displayed in the Columns and Measures section. For the Metric or Header you want to configure with a drop-down list of values, click on it and drag it up to the Table Prompts field:
The report display at the top of the page will automatically re-load with an updated view that includes the drop-down menu.
Use the Revert button on the right side if you want to undo the change; use the Done button to finish and go to the report's Criteria tab.
Note that what you created above is a Table Prompt, which means the drop-down menu will display when the report is displayed as a table. If you customize your report into a graphical view, you can create a Graph Prompt by following the same steps; the only difference is the Table Prompts field is instead labeled Graph Prompts.
Question:
How do I display the report as a graph?
Answer:
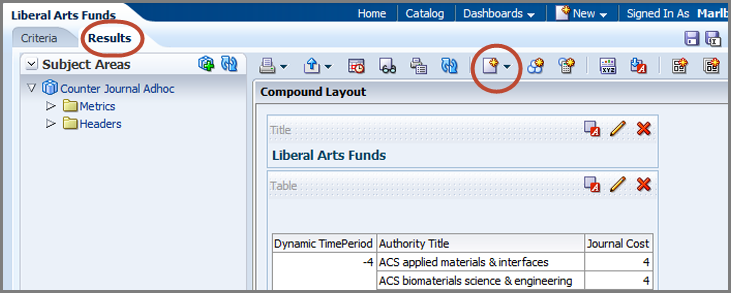
On the Results tab, use the New View button to select the type of graph you want:
The graph will display below the table view, so you will need to scroll down to view the graph. To remove the table view, click the red X at the top right of the table.
To change the style of the graph, use the Format Container button at the top right of the graph.
- Date Created: 10-Sep-2014
- Last Edited Date: 28-Oct-2015
- Old Article Number: 11226