
Higher-Ed-Platform Performance and Uptime Report for AP01 Instance (APAC) - Q2 2021
General
Uptime and Performance Quarterly Reports are published each quarter to provide a comprehensive view of our uptime and system performance.
This document details the uptime and performance report for the Higher-Ed-Platform (Alma, Primo VE, Leganto, Esploro) AP01 in APAC
Uptime is measured over the last three (3) months and over the last twelve (12) months.The report measures our uptime as defined in the Service Level Agreement.
System Performance is measured over the last three (3) months. The report measures our system performance for various products and in various system online activities such as UI screens and APIs.
Performance Report
The system performance as measured on server side, on a rolling 3 month basis for April 2021 - June 2021 :
| Product | Average (seconds) | 95% of all activity is faster than... (seconds) | What is being measured? |
|---|---|---|---|
 |
0.83 sec |
2.50 sec |
Staff user screens and online transactions |
 |
1.22 sec |
3.16 sec |
Search and full item details transactions |
 |
0.24 sec |
0.49 sec |
End-user resource list transactions |
|
|
0.17 sec |
0.46 sec |
API transactions for the platform products |

How is the Performance Calculated?
"Transaction Time" means the time a transaction takes place (in milliseconds) from when it is received by the system, until the system processes and returns a response, measured on the server.
The average performance calculation is based on the following calculation
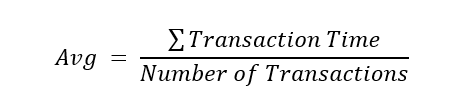
The 95% measure is calculated by aggregating all relevant transactions, ordering them from smallest to largest, and then identifying the time that 95% out of all transactions are faster (less) than this time.
Note that the performance measures are measured across all institutions within the instance.
Examples:
- An API call to Higher-Ed Cloud Platform: from the time a request was received in the system until the full API response (in whatever format chosen) was processed and sent back to the calling application
- The ‘All Titles’ screen in Alma: from the time the search query was received in the system until the full result was processed and the page of actual results was generated and sent back to the browser for rendering.
- The resource list display in Leganto: from the time that the system receives a request for a resource list until the list is generated and sent back to the browser for rendering.
Uptime Report
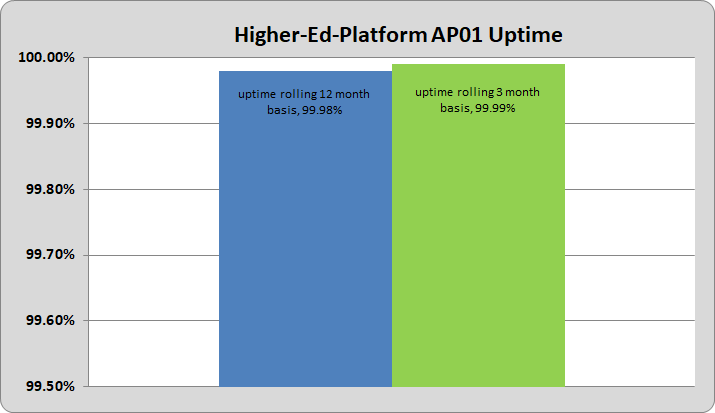
The uptime measured on a rolling 12 month basis July 2020 - June 2021 is 99.98%
The uptime measured on a rolling 3 month basis April 2021 - June 2021 is 99.99%
Please note our System Uptime Status page, which allows our customers to view the current status of their instance/environment at any time, using the following link: http://status.exlibrisgroup.com
Unscheduled downtime incidents in Q2 2021
|
Date |
Start time [SGT] |
End time [SGT] |
Duration |
Description |
|---|---|---|---|---|
| May 17, 2021 | 11:11 AM | 11:59 AM | 48 | An Oracle Statistics Job which was supposed to run at nighttime was running at daytime due to a scheduling error with regards to offset from UTC. As a result of the heavy daytime traffic this caused online session time outs resulting in errors. |
| June 02, 2021 | 14:58 PM | 15:20 PM | 22 |
Due to a malfunction in one of our data center network infrastructure components, we have lost network connection. Although we have a redundant infrastructure, the automatic failover process failed, and our engineers had to run it manually in order to bring the network back up |
| June 03, 2021 | 10:07 AM | 10:44 AM | 37 |
Scheduled downtimes during maintenance windows in Q2 2021
|
Start Date |
Day of week |
Start Time [SGT] |
End Time [SGT] |
Duration (Minutes) |
|---|---|---|---|---|
| April 04, 2021 | Sunday | 12:01 AM | 12:20 AM | 19 |
| May 02, 2021 | Sunday | 12:01 AM | 12:33 AM | 32 |
| May 08, 2021 | Saturday | 11:57 PM | 12:42 AM | 45 |
| June 06, 2021 | Sunday | 12:18 AM | 13:00 AM | 42 |
| June 13, 2021 | Sunday | 12:01 AM | 12:19 AM | 18 |
Total unscheduled downtime minutes during past 12 months
|
Quarter |
Total unscheduled downtime in Quarter (minutes) |
|---|---|
| Q3 2020 | 36 |
| Q4 2020 | 0 |
| Q1 2021 | 0 |
| Q2 2021 | 107 |
How is Uptime Calculated?
The uptime calculation is based on the following calculation (as defined in the Service Level Agreement):
"Uptime" means the total period in minutes during which the Service is available for access and use during this period.
“Uptime Percentage” means Uptime expressed as a percentage, calculated in accordance with the following formula:
Uptime Percentage = X /(Y–Z) × 100
Where:
X = Uptime
Y = Last 12 months period
Z = The duration (in minutes) of any SLA Exclusions* during these 12 months
*SLA exclusions are defined in the contract SLA (e.g. Scheduled maintenance, etc.)
Further Information
If you have any queries on the information within this report please contact Ex Libris through your usual channel.