
Common Analytics Procedures for Primo VE
Adding Subtotals to a Report
-
From the Global Header, select New > Analysis and then select Subject Area > Actions.
-
Create a report with the following columns:
-
Dates > Month (date)
-
Action Type > Action Group
-
Action Type > Action Sub Group
-
Action Type > Action
-
Action Usage > Actions
-
-
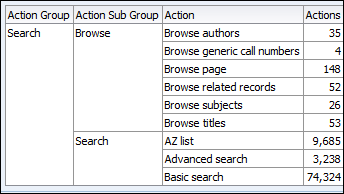
Select the Results tab to display the report. For example:
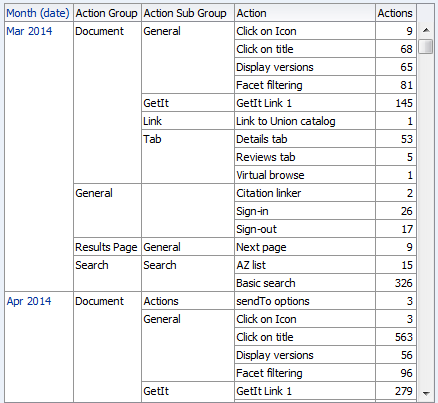 Actions per Month Report - Example
 -
Calculate a subtotal for each subgroup per month.
-
Select the Edit icon
 to display the Edit view.
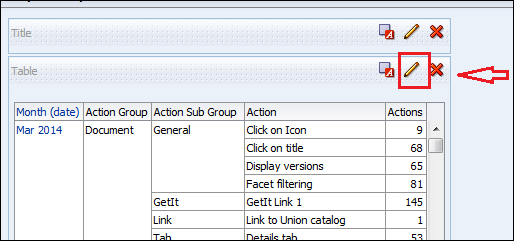 Edit View
 -
For the column that you want to calculate a subtotal, select the Sigma icon
 and then select After. For this example, the Action Sub Group column is used.
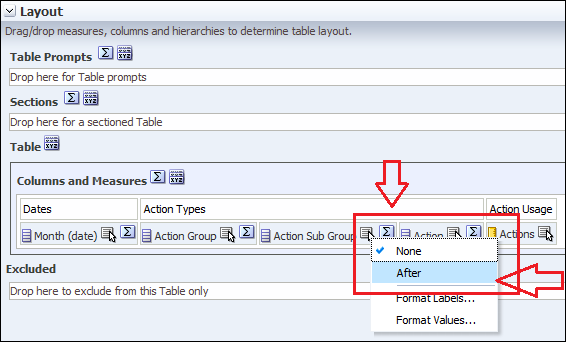 After OptionThe subtotals are now shown:
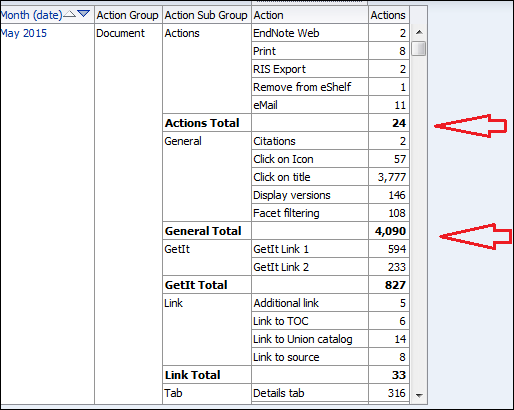 Subtotals
-
Creating a Report That Performs a Mathematical Formula on Two Columns
-
From Primo Analytics, select New > Analysis and then select Subject Area > Facets.
-
Create a report with the following columns:
-
Dates > Month Date
-
Facets Types > Facet Type
-
Facets Usage > Facets Selected
-
Facets Usage > Sessions
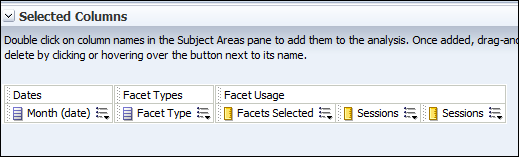
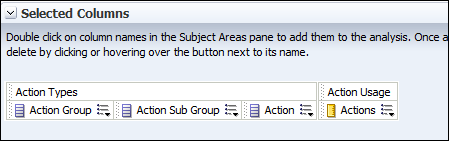
The criteria for the report appear as follows: Selected Columns
 -
-
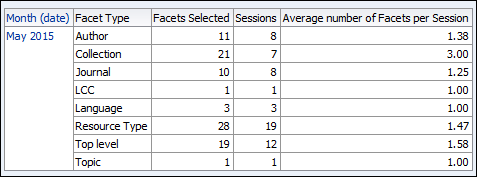
Select the Results tab. The following is an example of the results:
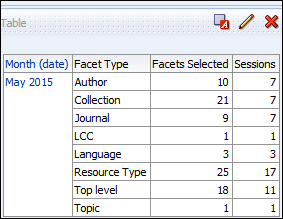 Report
 -
Select the Criteria tab and add a new column that is a measurement — for example, the Sessions column (it is okay that it is selected twice).
 Selected Columns
 -
Select the More Options icon
 of the new column and select Edit Formula. The Column Formula dialog box is displayed:
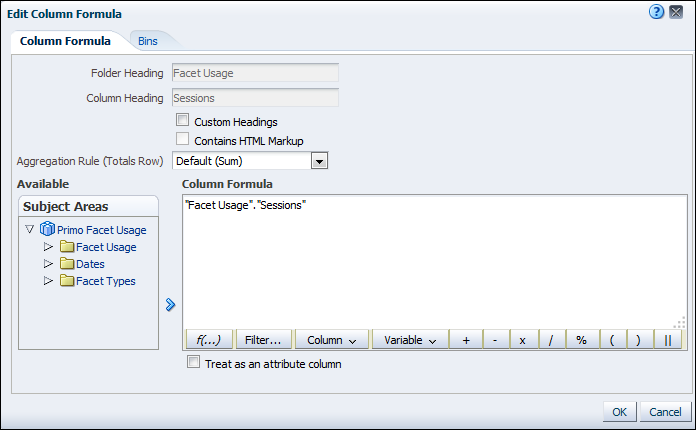 Edit Column Formula
 -
Delete the existing formula.
-
At the bottom of the Column Formula box, select the Columns tab and select Facets Selected.
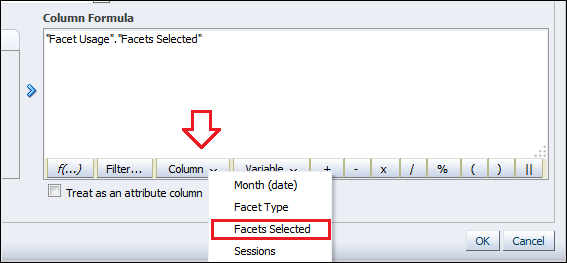 Facets Selected Option
 -
Place the cursor at the end of the formula and then select the forward slash
(/) button.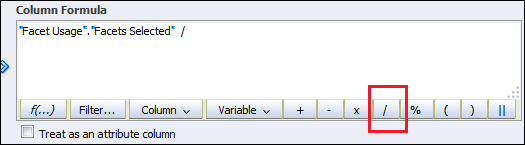 Add Division Symbol
 -
Select the Columns tab and select Sessions. The formula appears as follows:
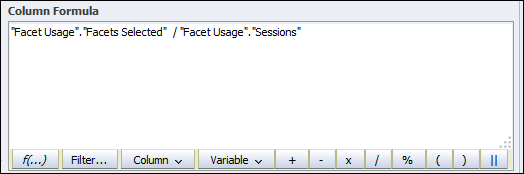 Updated Column Formula
 -
Select the More Options icon
 of the new column and select Column Properties > Column Format.
 -
Select the Custom Heading checkbox.
-
Enter a new name for the column in the Column Heading field.
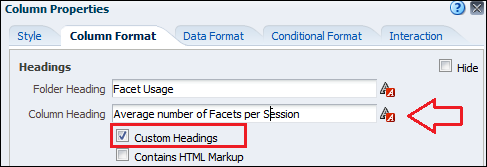 Custom Headings
 -
Select the More Options icon
 of the new column and select Column Properties.
 -
Select the Data Format tab and check the Override Default Data option.
-
Select 2 from the Decimal Places drop-down list and select OK.
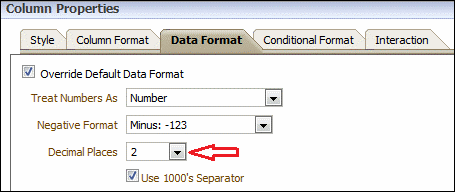 Adjusting Decimal Places
 -
Select the Results tab to display the report:
 Analytics Report
Displaying Values Above Each Bar in a Bar Graph
-
In Alma Analytics, select New > Analysis and then select Subject Area > Facet Usage.
-
Create a report with the following columns, for example:
-
Facet Types > Facet Type
-
Facet Usage > Facets Selected
-
-
In the Results pane select the New View icon
 and then select Graph > Bar > Default (Vertical).
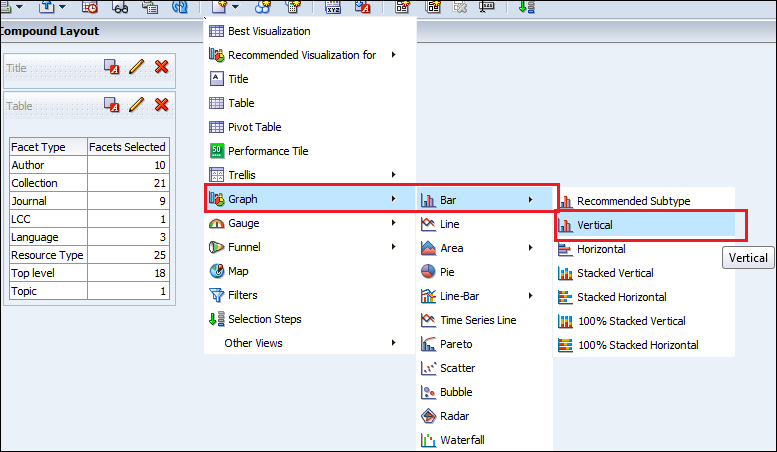 Default Bar Graph
 -
Select the Edit icon
 to edit the graph:
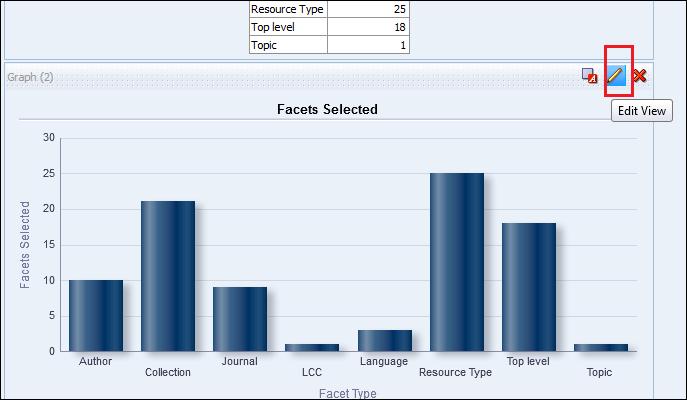 Pencil Icon
 -
Select the Edit Graph Properties icon
 :
: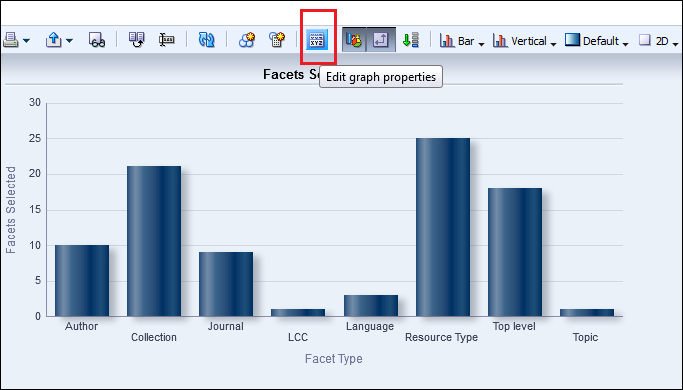 Edit Graph Properties Icon
 -
On the Titles and Labels tab, select Data Markers:
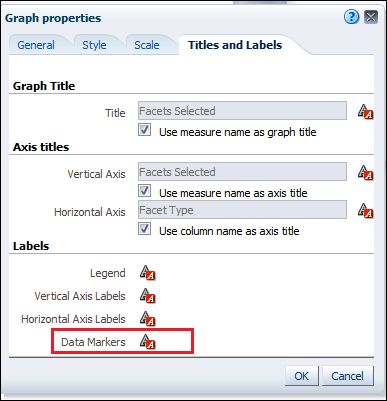 Titles and Labels
 -
On the Display Options tab, select Always:
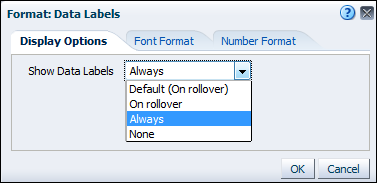 Display OptionsThe values are now displayed on the top of each bar of the bar graph:
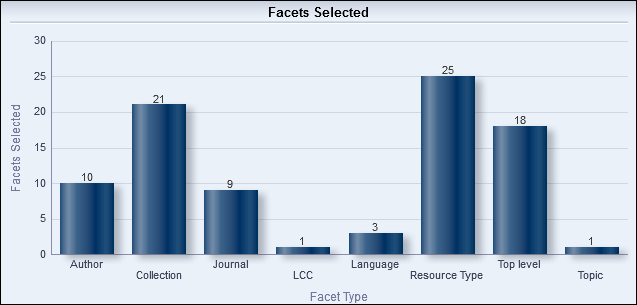 Values on Top of Each Bar
Merging Two or More Fields in a Report
-
Select New > Analysis.
-
Select Subject Area > Actions.
-
Create a report with the following columns — for example:
-
Action Types > Action Group
-
Action Types > Action Sub Group
-
Action Types > Action
-
Action Usage > Actions
 Selected Columns
 -
-
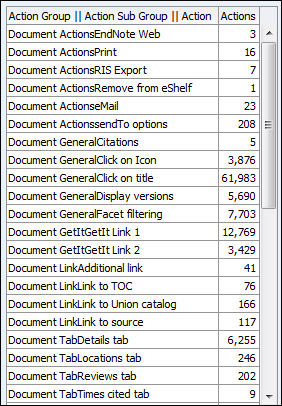
Select the Results tab and verify that the columns have been merged:
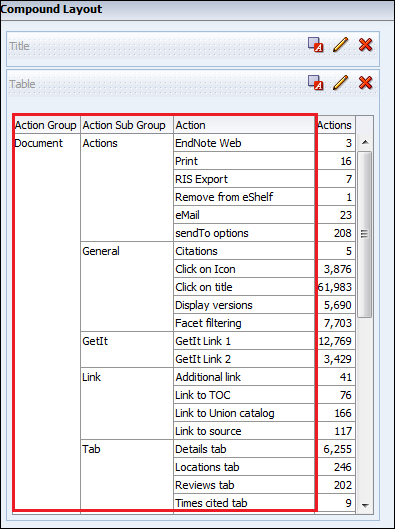 Compound Layout
 -
In the Criteria tab of each column that you want to merge, select the More Options icon
 and then select Edit Formula:
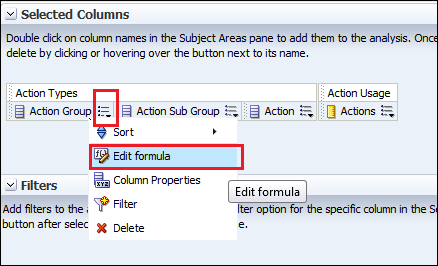 Edit FormulaThe formula of the column is displayed:
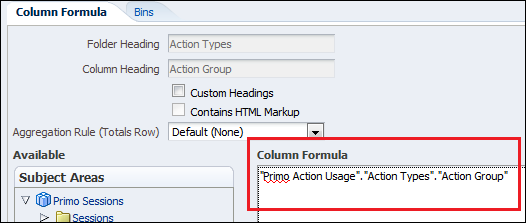 Column FormulaThe formulas are as follows:
-
Action Group – "Primo Action Usage"."Action Types"."Action Group"
-
Action Sub Group – "Primo Action Usage"."Action Types"."Action Sub Group"
-
Action – "Primo Action Usage"."Action Types"."Action"
-
-
Select the More Options icon
 .
. -
Select Edit Formula for the Action Group field.
-
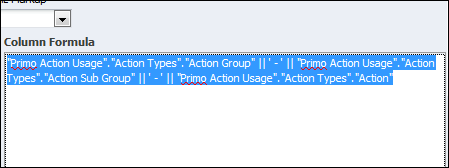
After the existing formula, add a pipe and then formulas of the field (or fields) that you want to appear. For example:"Primo Action Usage"."Action Types"."Action Group" || "Primo Action Usage"."Action Types"."Action Sub Group" || "Primo Action Usage"."Action Types"."Action"
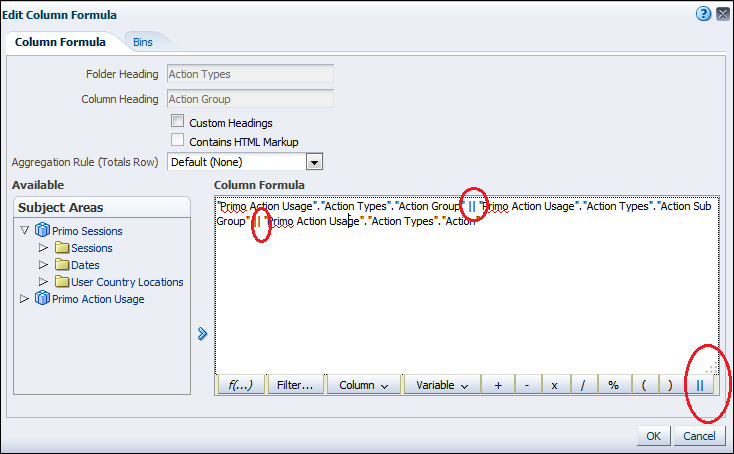 Column Formula
 -
Delete the non-desired fields (Action Sub Group and Action fields) by selecting the More Options icon
 next to the field and then selecting Delete. The updated criteria appear as follows:
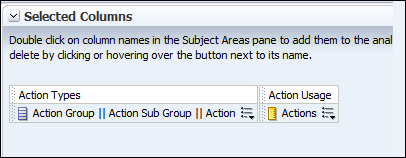 Selected Columns
 -
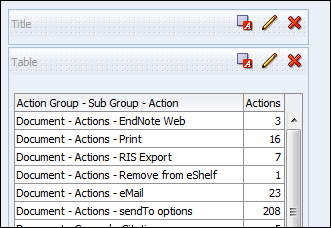
Select the Results tab. The column now contains Action Group, Sub Group, and Action:
 Merged Fields - No Delimiters
 -
To add delimiters between the merged fields, select the More Options icon
 and then select Edit Formula.
 -
After each double pipe symbol (||), add the following text to include a dash between each field in the merged column results: ' - ' ||.Change the following formula:"Primo Action Usage"."Action Types"."Action Group" || "Primo Action Usage"."Action Types"."Action Sub Group" || "Primo Action Usage"."Action Types"."Action"To the following formula:"Primo Action Usage"."Action Types"."Action Group" || ' - ' || "Primo Action Usage"."Action Types"."Action Sub Group" || ' - ' || "Primo Action Usage"."Action Types"."Action"
 Edit Column Formula
 -
Select the Results tab.The fields are separated with a space, dash, and space between each part:
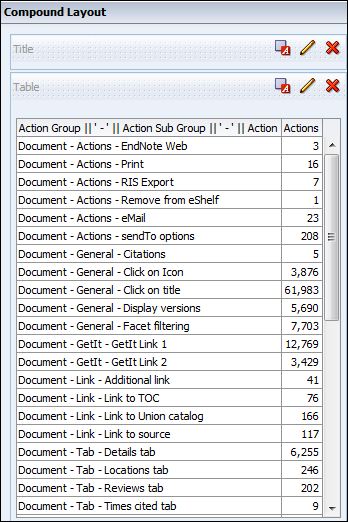 Compound Layout
 -
Rename the merged field:
-
Select the More Options icon
 and select Column Properties:
 -
Enter a new name in the Column Heading field.
-
Select the Custom Headings checkbox.
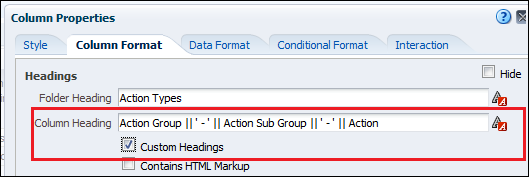 Column Heading
 -
Change the Column Heading field.
-
-
Select the Results tab to see the results:
 Compound Layout
Using the CASE Condition to Change Text in a Report
-
The value for the LCC Facet type is changed to Library of Congress.
-
The value for the Journal Facet type is changed to Journal title.
-
Create a report with the following columns from the Facet Usage subject area:
-
Facet Types > Facet Type
-
Facet Usage > Facets Selected
-
-
In the Criteria column, select the More Options icon
 of the Facet Type column and select Edit Formula. The Column Formula dialog box opens:
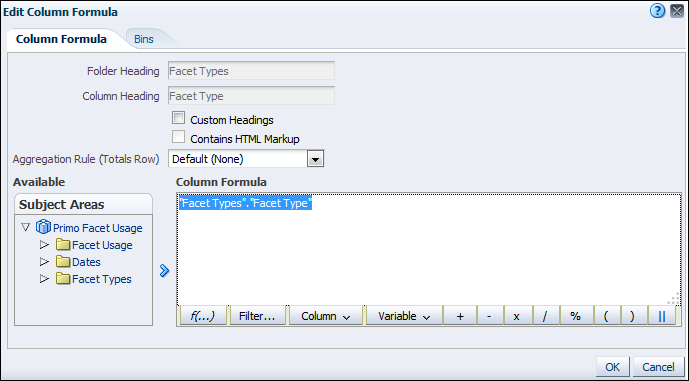 Edit Column Formula - Action Group
 -
Delete the existing formula.
-
Select the Function button in the Column Formula area:
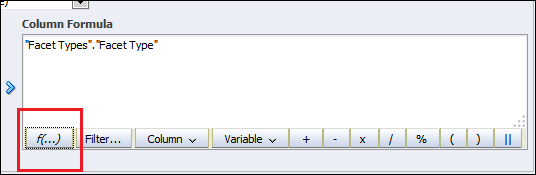 Function Button
 -
The Insert Function dialog box opens:
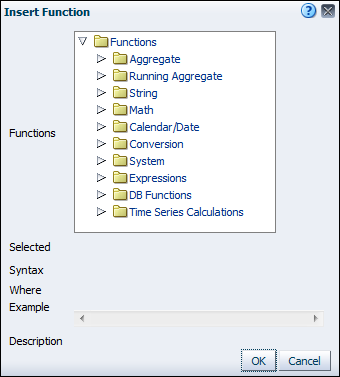 Insert Function Dialog Box
 -
Select the Expressions folder and then Case (Switch):
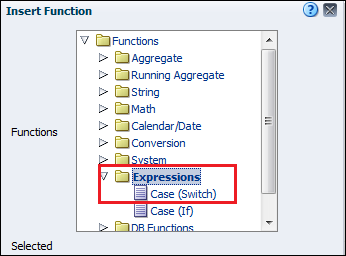 Select Expressions FolderThe formula now displays as follows:
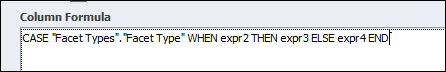 Column FormulaThe placeholder expressions (expr2, expr3, and expr4) need to be changed as follows:
-
expr2 – Replace expr2 with LCC. The value must be enclosed in single quotes.
-
expr3 – Replace expr3 with Library of Congress. The value must be enclosed in single quotes.
-
expr4 – Should be the Facets Types.”Facet Type” field. This can be done by selecting Facet Types/Facet Type in the Subject Areas pane, highlighting expr4 in the formula, and then selecting the right arrow.
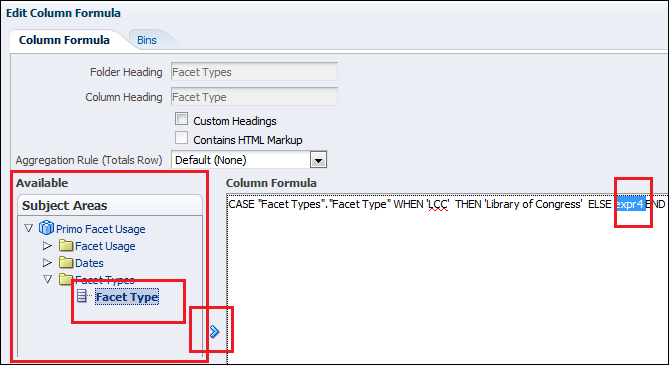 Edit Column FormulaThe formula should now appear as follows:
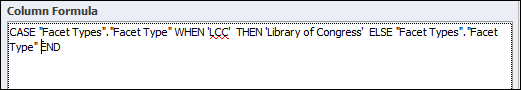 Updated Column Formula
 -
-
Select the More Options icon
 of the new column and select Column Properties > Column Format.
 -
Select the Custom Heading option.
-
Enter a new name for the column in the Column Heading field.
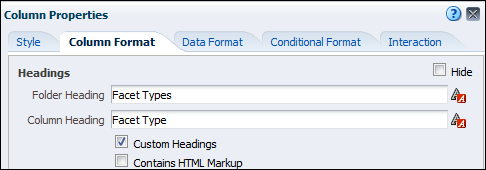 Column Properties
 -
Select the Results tab to display the report. LCC now displays as Library of Congress.
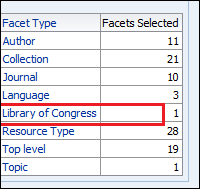 LCC Displays in Results
 -
It is possible to add multiple conditions as shown in the following steps:
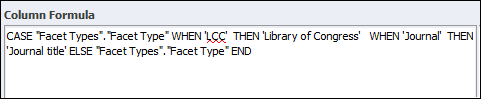 Adding Multiple ConditionsThe report now appears as follows:
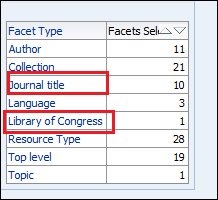 Updated Results
Conditionally Changing the Text Format in a Report

-
In the Actions field, select the More Options icon
 and select Column Properties:
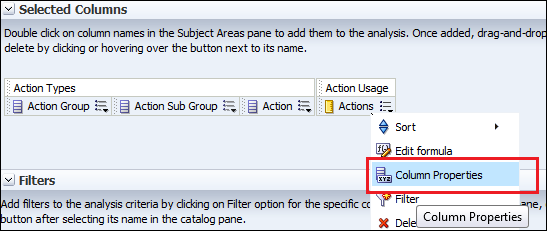 Column Properties
 -
On the Conditional Format tab, select Add Condition > Actions.
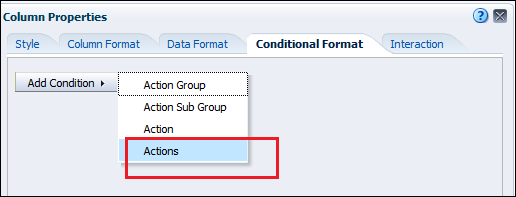 Conditional Format
 -
For example, configure the following fields and then select OK to add the new condition:
-
Operator – Select is greater than.
-
Value – Select 10000.
-
-
Select is greater than from the Operator field and then select 10000 from the Value field.
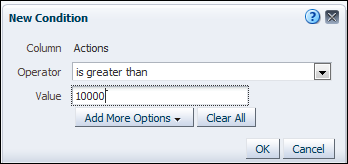 Add New Condition
 -
Select the style for the value – for example, change the background color to yellow.
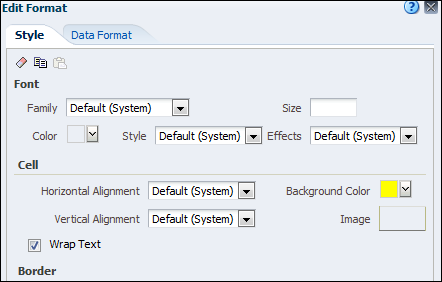 Change Value’s Background to YellowActions that are greater than 10,000 now have a yellow background in the results.
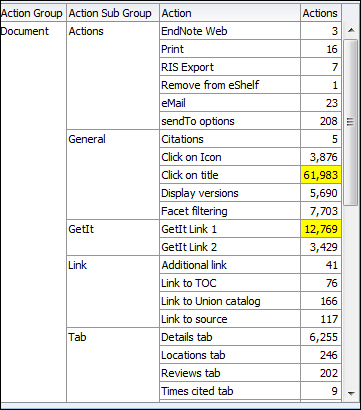 Highlighted Values in Results
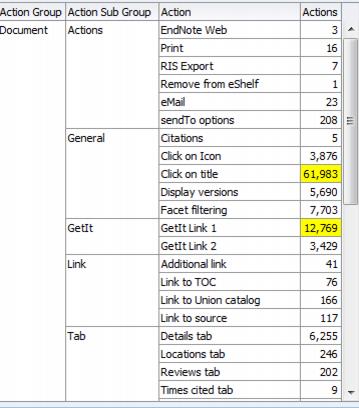
Creating a Prompt in a Report
-
Select New > Analysis.
-
Select Subject Area > Actions.
-
Select from the following columns — for example, the Action Group column:
-
Action Types > Action Group
-
Action Types > Action Sub Group
-
Action Types > Action
-
Action Usage > Actions
-
-
Select the More Options icon
 and select Filter.
 -
In the New Filter dialog box, specify the following fields.
-
Operator – Select is equal to / is in.
-
Value – Select Search.
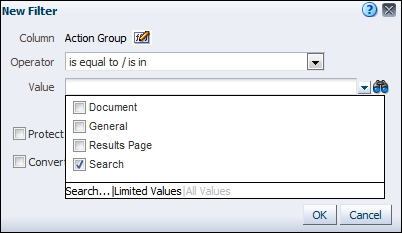 Add New FilterDo not set filters for the columns that you want to have a prompt.
 -
-
Select the Results tab. For example, the following is displayed:
 Report Results
 -
On the Prompts tab, select the plus sign to add a new prompt.
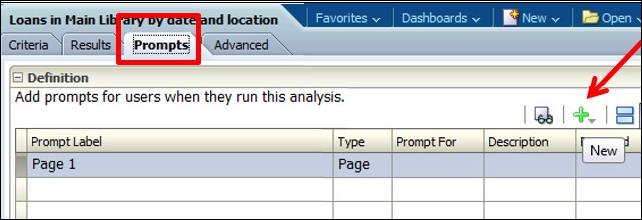 Prompts Tab
 -
Select More Columns.
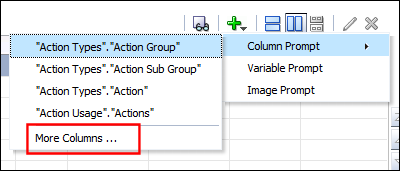 More Columns Option
 -
Select the Dates > Date field.
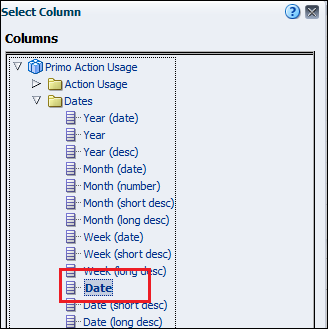 Select the Date Option
 -
In the New Prompt dialog box, specify the following fields for the date and select OK.
-
Operator – Select is between.
-
User Input – Select Calendar.
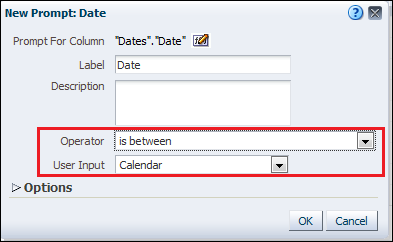 New Prompt Dialog Box
 -
-
Navigate to the report from the Catalog/Dashboard in which it was saved.
-
Select the Open action (not Edit) to run the report.
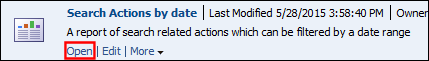 Run Report - Open ActionThe prompts are displayed:
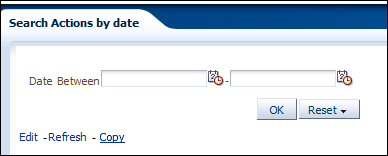 Date Prompt
 -
Specify the date range and select OK.
Managing Reusable Columns
Reusable columns allow you to add common functionality to many reports without having to maintain these columns for each report. All changes made to a reusable column are applied automatically to all reports that use it.
Creating a Reusable Column
-
Create a new report by selecting New > Analysis and a Subject Area (such as Primo Action Usage).
-
Add any new field (such as Date) to the report.
-
From the new column's menu, select Edit formula to open the Edit Column Formula dialog box:
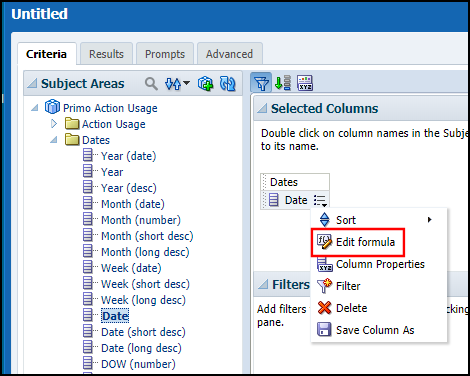 Column Menu - Edit Formula
-
Specify the following fields:
-
Custom Headings – Select this checkbox.
-
Column Heading – Enter the display label for the reusable column.
-
Column Formula – Specify the formula used to display the information for the column.
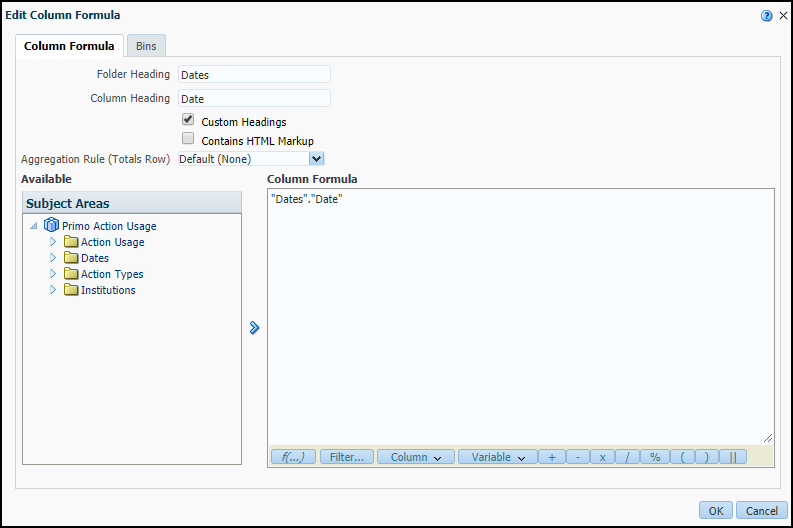 Edit Column Formula Dialog Box
 -
-
Select OK.
-
-
From the column's menu, select Save Column As to open the Save As dialog box.
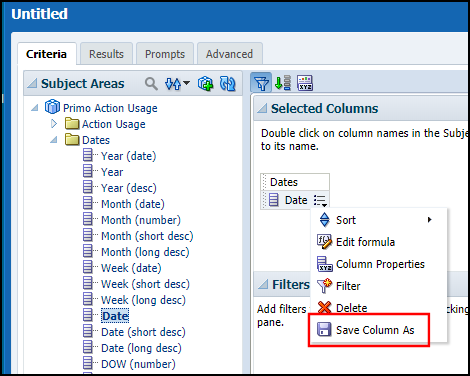 Column Menu - Save Column As
-
Specify the following fields:
-
Save In – Select the location under My Folders or Shared Folder to which you want to save the reusable column.
-
Name – Specify a name that conveys the column's functionality.
-
Description – Specify a description for the column if more information is needed.
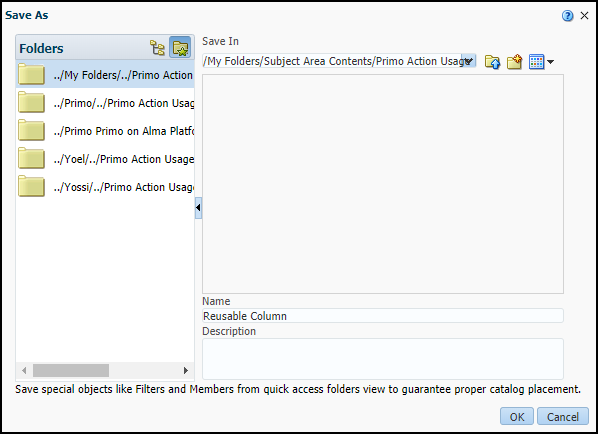 Save As Dialog Box
 -
-
Select OK.
-
Deleting a Reusable Column
If a reusable column is no longer needed, make sure that it is not used by any report before deleting it.
-
Open the Catalog page.
-
Navigate to the reusable column's location in the Folders pane.
-
From the reusable column's menu, select Delete.
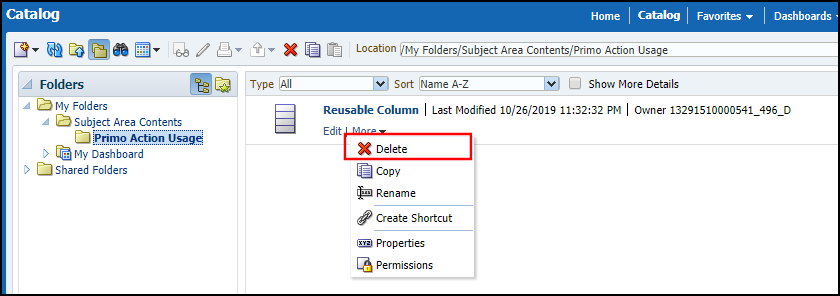 Column Menu - Delete
Modifying a Reusable Column
After a reusable column has been created, you can modify its properties and formula.
-
Open the Catalog page.
-
Navigate to the reusable column's location in the Folders pane.
-
From the reusable column's menu, select Edit and the following options as needed: Column Properties or Edit Formula.
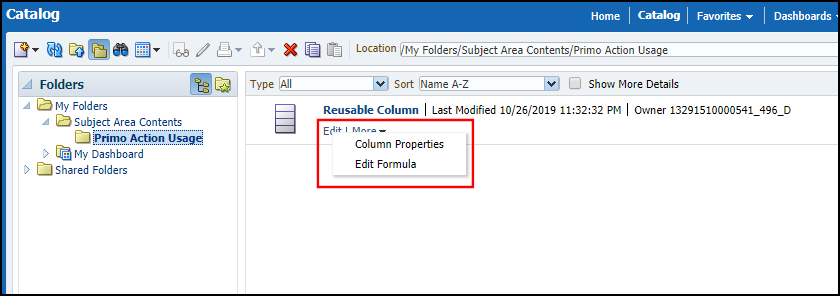 Column Menu - Edit
 -
In the selected dialog box, make your changes to the reusable column and save your changes.
Renaming a Reusable Column
After a reusable column is created, you can rename it.
-
Open the Catalog page.
-
Navigate to the reusable column's location in the Folders pane.
-
From the column's menu, select Rename to open the Rename dialog box:
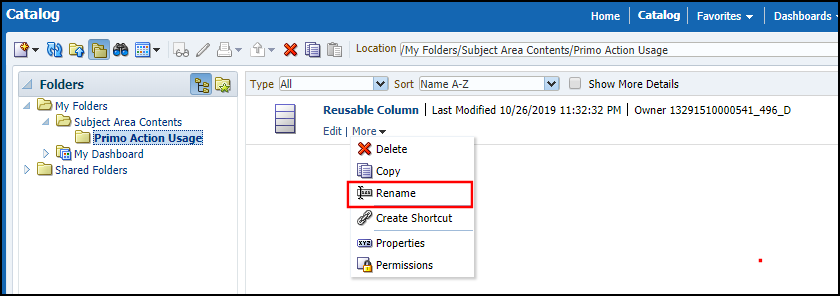 Column Menu - Rename
-
Specify the following fields:
-
Name – Specify a new name for the reusable column. This may be useful to convey any changes to the column.
-
Preserve references to old name of this item – Select this checkbox to ensure that all reports using this column retain their association with this reusable field. Otherwise, links to this reusable column will be broken.
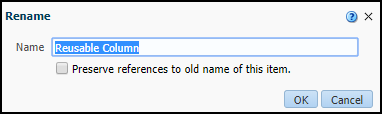 Rename Dialog Box
 -
-
Select OK.
-
Adding the Data Availability or Data Updated Timestamp to a Report Header
Primo Analytics enables you to add the following timestamps to your reports:
-
Data Available As Of - The time and date on which data from Primo was last processed and made available for viewing in Primo Analytics reports.
-
Data Updated As Of - The time and date on which the data was last extracted from Primo.
Since these timestamps can be used in any report without customization, you could store them in reusable columns for easy access. For more information, see Creating a Reusable Column.
-
Modify an existing report.
-
From the Criteria tab, add a new field (for example, Date) and then move it to the first column position on the left side of the table.
-
From the new column's menu, select Edit formula to open the Edit Column Formula dialog box:
Column Menu - Edit Formula-
Specify the following fields:
-
Custom Headings – Select this checkbox.
-
Column Heading – Enter the display label for the reusable column (for example, Data Updated As Of).
-
Column Formula – Specify the formula used to display the information for the reusable column. The timestamps are stored with the NQ_SESSION.DATA_UPDATED_AS_OF and NQ_SESSION.DATA_AVAILABLE_AS_OF variables. If a variable has not been set by Ex Libris, the system returns the default date of January 1, 1920.
Examples:
-
If you want to display the date when the data was last extracted from Primo, enter the following formula:
VALUEOF(NQ_SESSION.DATA_UPDATED_AS_OF) -
If you want to display the time in EST (US Eastern Standard Time), which is UTC-05, enter the following formula:
TIMESTAMPADD(SQL_TSI_HOUR, -5, TIMESTAMPADD(SQL_TSI_MINUTE, -0, VALUEOF(NQ_SESSION.DATA_UPDATED_AS_OF) )) -
If you want to display the time in ACST (Australian Central Standard Time), which is UTC+09:30, enter the following formula:
TIMESTAMPADD(SQL_TSI_HOUR, 9, TIMESTAMPADD(SQL_TSI_MINUTE, 30, VALUEOF(NQ_SESSION.DATA_UPDATED_AS_OF) ))
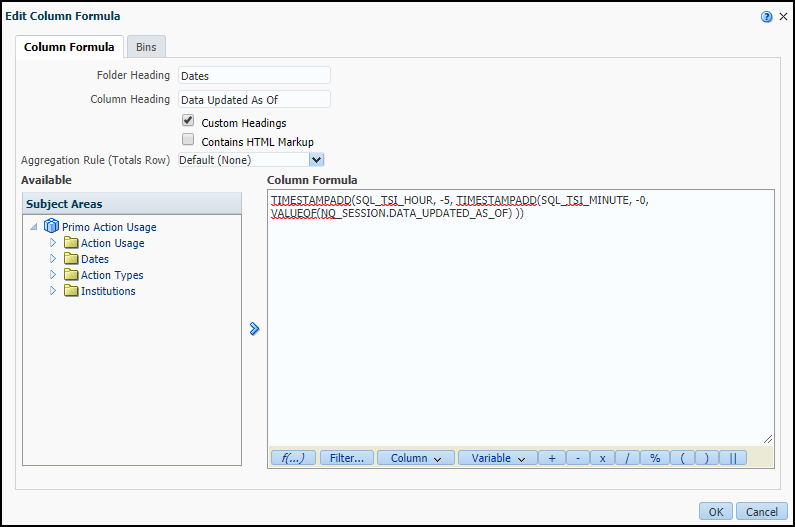 Edit Column Formula Dialog Box
 -
-
-
Select OK.
-
-
On the Results tab, select the Pencil icon of the data container (normally a table) holding the new column.
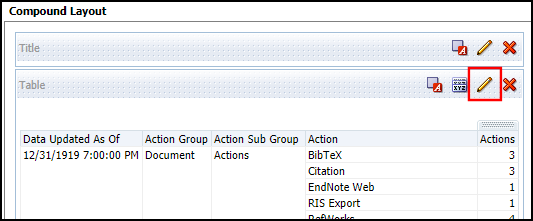 Edit New Column's Data Container
 -
In the Layout pane, move the new column in the Column and Measures section to the Excluded section and then select Done to prevent the new column from appearing in the results.
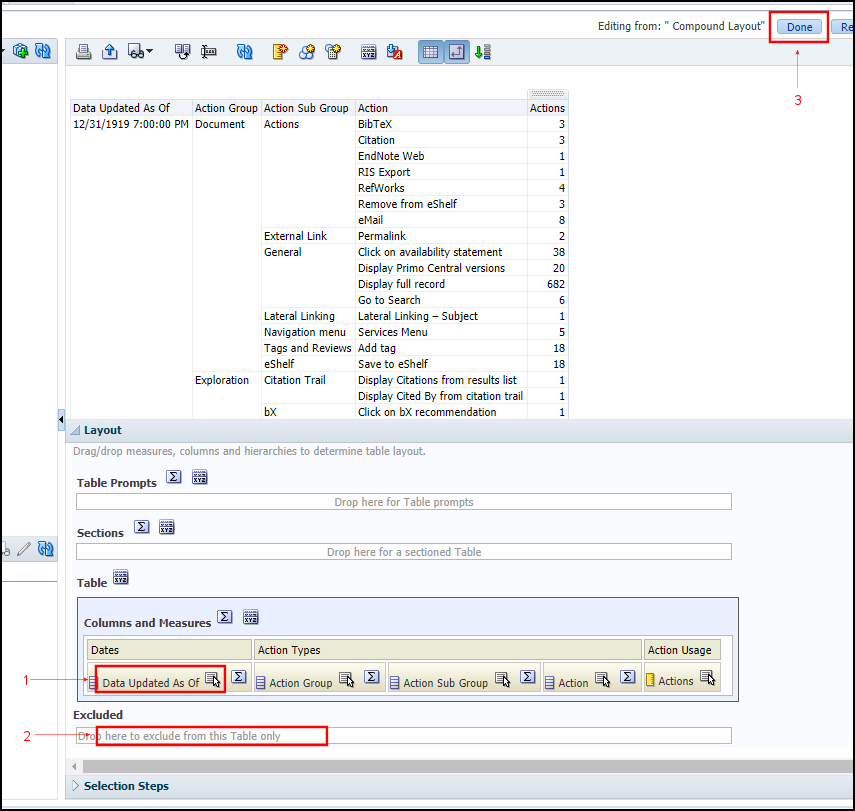 Exclude New Column from Display
 -
Above the Compound Layout pane, select Narrative under New View > Other Views menu to add a narrative to the report.
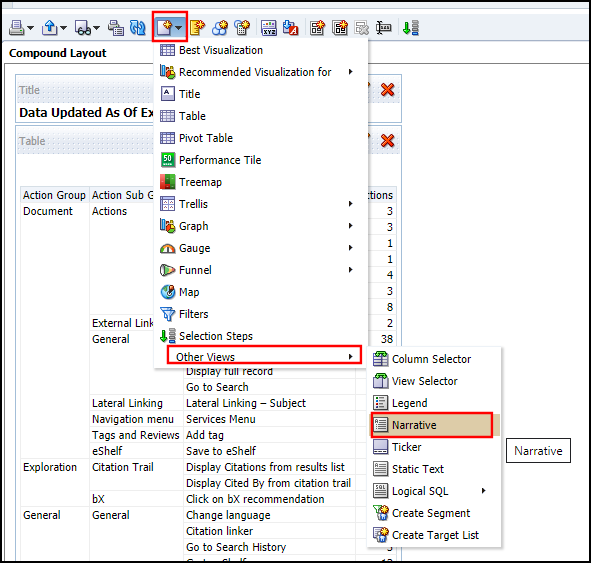 Add Narrative to Report
 -
Move the Narrative container to the desired position in the report (such as the row below the Title).
-
In the Narrative container, select the Pencil icon to open the Narrative dialog box.
-
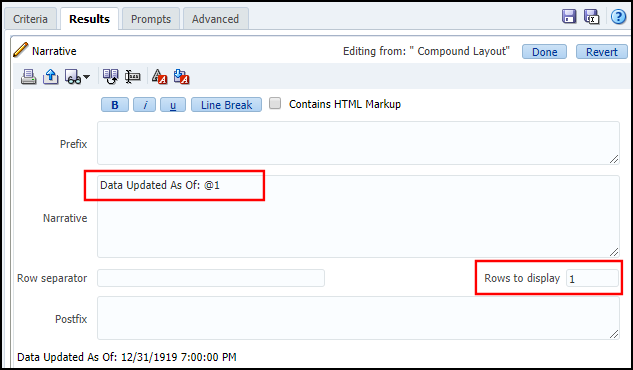
Specify the following fields in the Narrative dialog box and then select Done:
-
Narrative – Specify the label for the narrative and the column in which the data was stored. For example: Data Updated As Of: @1.
-
Rows to display – Set to 1 so that the data does not repeat for every row in the report.
 Edit the Narrative's Text
 -
-
Open the report to confirm that it is working as expected.
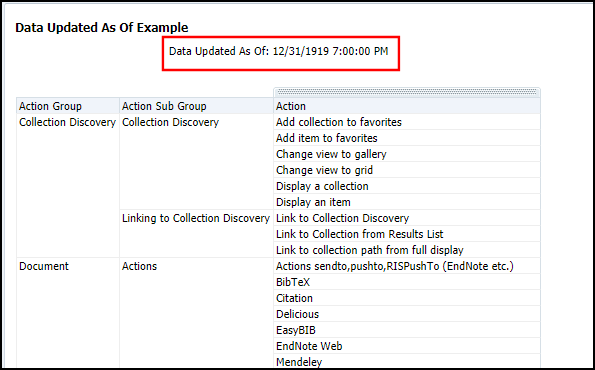 Sample Report Output