Dashboard Monitoring
The dashboard is available only to Primo on-premises customers and is not supported in Primo Cloud or Primo VE environments. For more details on Primo VE configuration, see Primo VE.
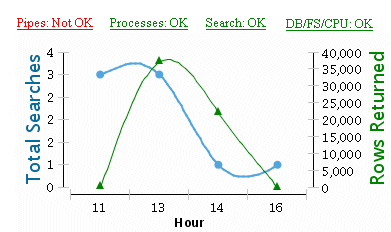
On the Back Office's home page, you can quickly monitor the status of your search engines via the Dashboard Monitor, which displays graphically the total amount of searches performed within the last six hours and the average amount of records returned for those searches.

Dashboard Monitor
In addition, status indicators above the graph display an overall status of the system's processes, pipes, search engines, file system, CPU load, and database. You can click on the status indicator links to display more in-depth information.
Monitoring Pipe Status
To monitor the status of Primo's pipes:
-
View the pipes status indicator located above the search statistics graph on the Back Office’s home page.
-
Pipes: OK – Indicates that the pipes are functioning properly.
-
Pipes: Not OK – Indicates that the system disabled one or more of the pipes.
-
-
Click the status indicator to display more in-depth information on the status of the pipes.The Pipes Monitoring page opens, listing the system's pipes. The status of each pipe is provided in the Process Status and Process Stage fields. For additional information on Monitoring the system's pipes, see Pipe Monitoring.
Monitoring Process Status
You can view your processes, but Ex Libris will monitor and maintain all processes for cloud installations.
To monitor the status of Primo's processes:
-
View the processes status indicator located above the search statistics graph on the Back Office’s home page.
-
Processes: OK – Indicates that the system's processes are functioning properly.
-
Processes: Not OK – Indicates that the system has disabled one or more of the processes.
-
-
Click the status indicator link to display more in-depth process status information.
The Process Monitoring page displays the system's processes. Any disabled processes appear in red, allowing you to view a log of the process and a list of the specific errors that caused the system to disable the process. For additional information on Monitoring the system's processes, see Process Monitoring.
Monitoring Search Engine Status
You can view the status for the SEs, but Ex Libris will monitor and maintain the SEs for cloud installations.
To monitor the status of Primo's search engines:
-
View the search engine status indicator located above the search statistics graph on the Back Office’s home page.
-
Search: OK – Indicates that the search engine is functioning properly.
-
Search: Not OK – Indicates that the search engine is not functioning properly.
-
Search: Slow – Indicates that the search engine has a high volume of activity.
-
-
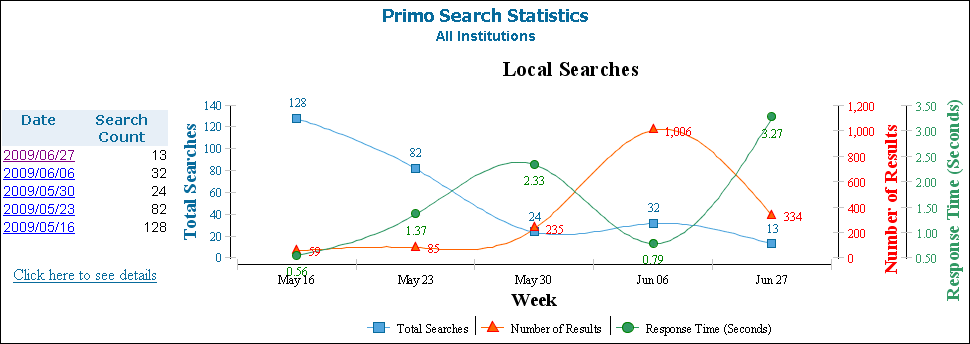
Click the status indicator link to display more in-depth search engine status information.You can also access the search engine statistics by using the instructions provided in Primo Reports.The Primo Search Statistics page displays graphs of your system's local and remote searches.
 Primo Search Statistics PageEach of the graphs display statistics about the searches performed on your Primo system. You can view the total number of searches performed on a particular day, the total number of results returned for those searches, and the average time it took for the system to return those results.You can click a date link on the left side of the page to display the statistics for a specific week. You can return to the weekly view by clicking the View Grouped by Week link.
 -
Click the Click here to see details link to display the search statistics in a tabular format.The search statistics display in a table beneath the graph.
 Primo Search Statistics DetailsSearch Statistics Details describes the search statistics details.
Search Statistics Details Field Description DateThe date on which the search statistics are based.Number of SearchesThe number of searches included in the statistic.Average Number of ResultsThe average number of results returned for the searches.Average Response Time (Seconds)The average number of seconds it took the system to return the search results.You have successfully monitored your system's Primo search engine.
Monitoring Database Status
To monitor the status of Primo's database, file system, and CPU:
-
View the DB/FS/CPU status box located above the search statistics graph on the Back Office’s home page.
-
DB/FS/CPU: OK – Indicates that the database, file system, and CPU are functioning properly.
-
DB/FS/CPU: Not OK – Indicates one of the following:
-
The database is about to run out of available space
-
The folder containing the file system is full
-
CPU is not functioning properly
-
There are invalid indexes being used.
-
-
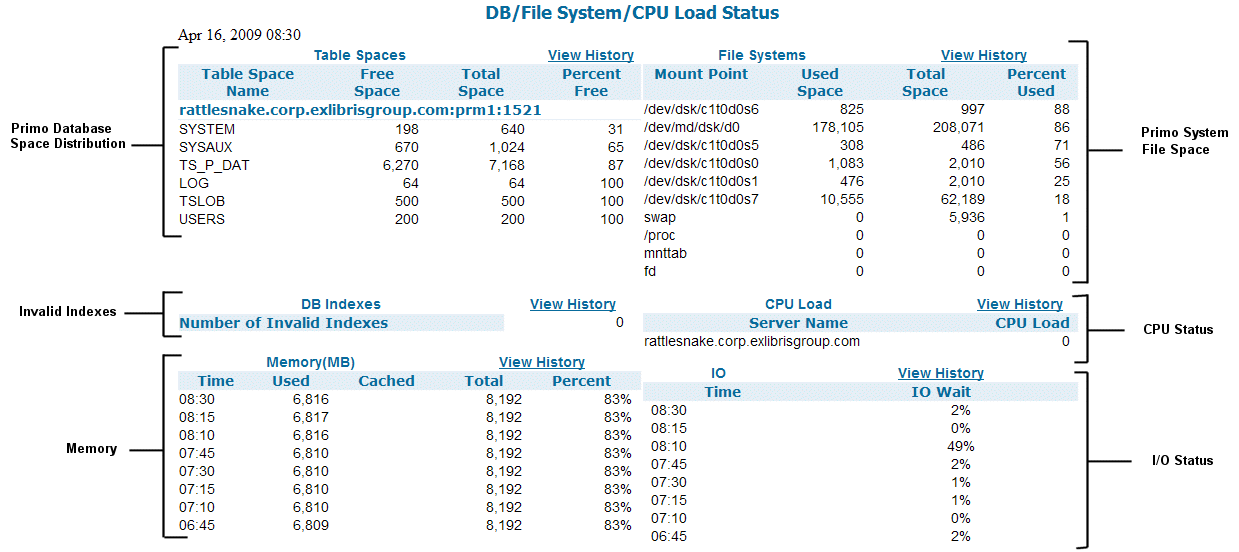
Click the status box to display more in-depth information regarding the database, file system, and CPU.The DB/FS/CPU Load Status page opens, showing the distribution of the space in the Primo database, the space used for the system files, invalid indexes, CPU status, and I/O and memory status.
 DB/FS/CPU Load Status Page
DB/FS/CPU Load Status Description Column Name Description Table Spaces:Table Space NameLists all the tables in Primo's database.A table name that appears in red indicates that the database's free space is under the minimum requirement.Free SpaceLists the number of free kilobytes in each of the tables.Total SpaceLists the total number of kilobytes allotted for each of the tables.Percent FreeLists the percentage of free space in each of the tables.The minimum amount of free space necessary is ten percent.File Systems:File System NameLists the path of the system files in the directory.Used SpaceLists the number of free kilobytes being used for each of the files.Total SpaceLists the total number of kilobytes allotted for each of the files.Percent UsedLists for each file the percentage of space being used. The maximum amount of free space necessary is 90 percent.Indexes:Number of Invalid IndexesDisplays the number of invalid indexes in the system.CPU Load:Server NameLists the servers used with the system.CPU LoadLists the number of loads on each of the system's servers.Memory:TimeDisplays the time.UsedDisplays the amount of memory used.CachedDisplays the amount that was cached.TotalDisplays the total memory used.PercentDisplays the percentage of memory that was used.I/O:TimeDisplays the time.I/O WaitDisplays the percentage. -
Click View History in Table Spaces, File Systems, Indexes, or CPU Loads to view each section's history.The History page opens, showing the history information for each of the system's servers.

