Intota Assessment: Using the Functionality in your Consolidated Usage and Cost Reports
- Product: Intota Assessment
Do you have any information on navigating around the Assessment site and any available options when viewing a report?
Once the usage and cost data in your Intota or Client Center profile has been processed and validated, you are ready to look at the consolidated reports where your data has been aggregated on the Intota Assessment reporting platform.
Accessing Intota Assessment
How to access your consolidated reports from within your Client Center or Intota profile:
-
Client Center:
Select the Intota Assessment button on the 360 Counter page:

-
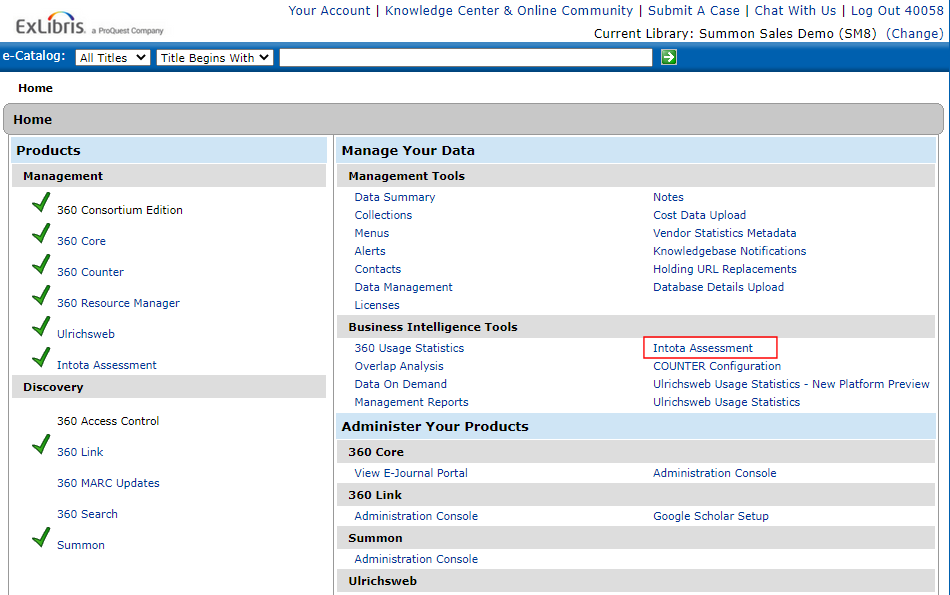
If you are opening up Client Center solely to view consolidated reports, the Client Center home page provides a quick link to Intota Assessment:
-
Intota:
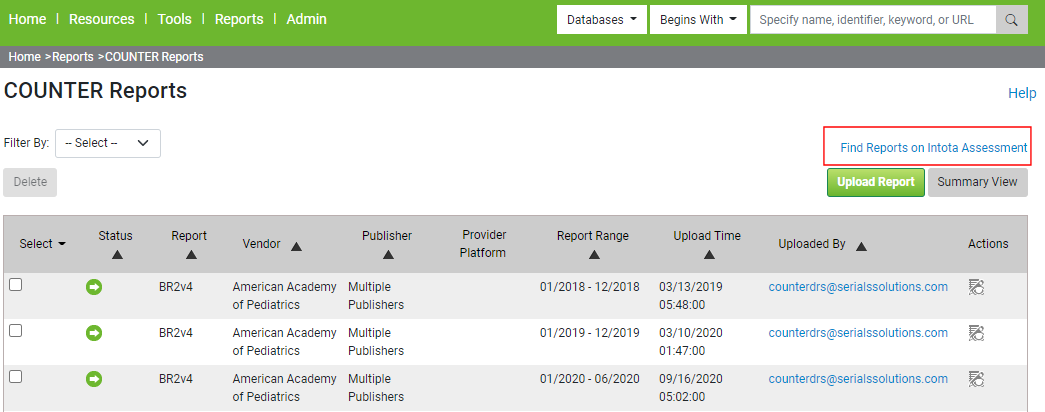
Select the Find Reports on Intota Assessment link on the Counter Reports page:
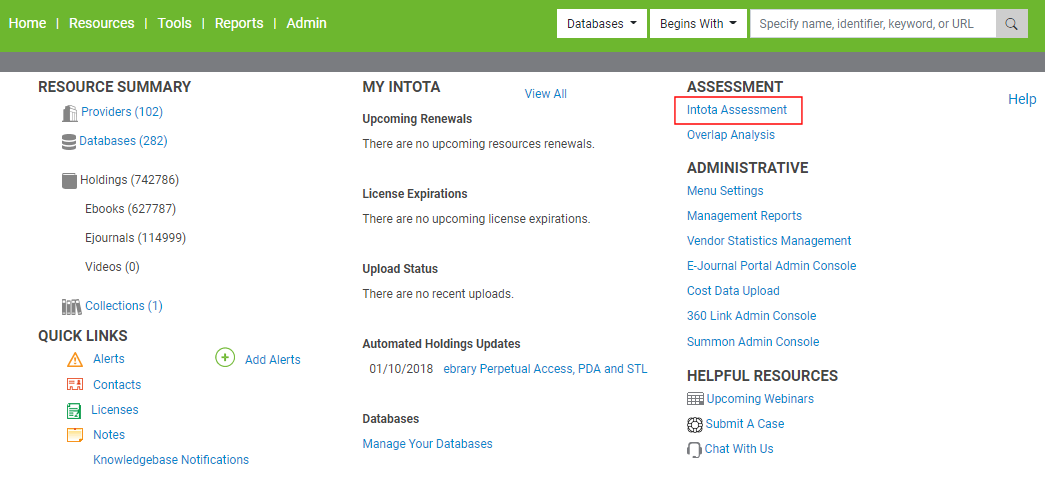
If you are opening up Intota solely to view consolidated reports, the Intota home page provides a quick link to Intota Assessment:
You can also use your Client Center and Intota logins to access Intota Assessment directly.
Reports Overview
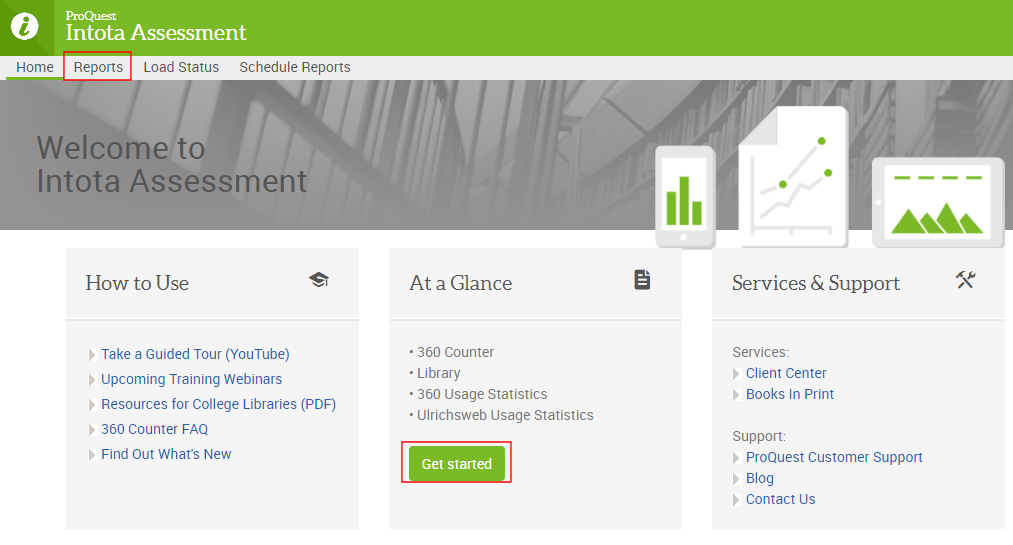
On the Intota Assessment home page, use the upper left side Reports link, or the Get Started button in the middle of the page, to access the list of available reports:
Intota Assessment reports cover a range of topics. Note that 360 Counter users have access to a subset of report types:
Report Filters
Most assessment reports are generated for a particular period of time, and by default the system waits to generate a report until you provide your desired time period. The asterisk '*' next to the Month (from / to) filter (as in the example Ejournal Report below) indicates that it is a required field for report generation.
-
The Month from date field is required, the Month to field can be left blank to generate the report through present day.
-
You have the option to set the default report display to a particular time period. See the Report Options section below for information on the Save Current Customization setting.

A few additional notes about the report filters:
Use of quotation marks (" "): The report filters support the use of quotation marks when conducting a known item search. For example, entering "animal ecology" into the Title filter will retrieve titles containing the two words next to each other.
Provider, Publisher, and Database filters: These filters display resources for which your library has uploaded usage reports. Note that the provider, publisher, and database lists are updated at the same time as your usage and cost data. See the upload schedule for details. If you have very recently uploaded a usage report from a provider for the first time, it is likely that the provider and its databases will not yet be included in the filter drop-down lists.
If you have trouble locating the filter value you want to select, you can use the More/Search option to help you find the value(s) you are looking for:
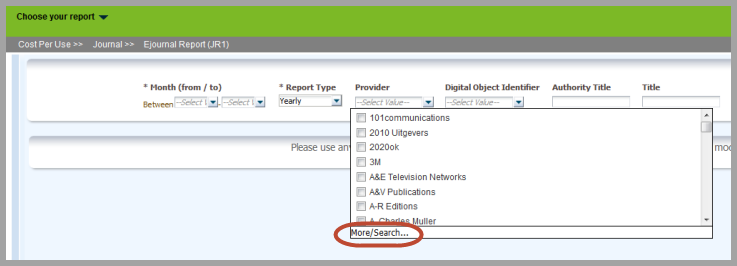
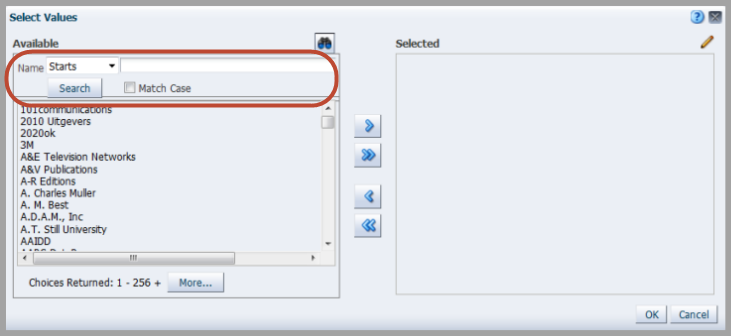
Below is a sample More/Search window for the Provider filter. Use the top left search box to query the list:
-
Click on a value displayed below the search box, and use the > button in the middle of the window to move the value to the right side Selected column containing values to be included in the report.
-
Note that the Match Case checkbox is for conducting a case-sensitive query.
-
-
To edit a value in the Selected column so that it displays differently in the report, click the pencil icon on the top right of the window.
ISSN and ISBN filters: 360 COUNTER Book and Journal reports often times have report filters for Print and Online ISBN and ISSN. Filtering a report by multiple ISBNs or ISSNs is done by using the same More/Search option described above for the Provider and Database filters.
-
Note that if you search for an ISSN, include a hyphen (-) when you enter the ISSN. For example, enter 1234-5678, not 12345678.
-
Hyphens are not needed when searching for an ISBN.
-
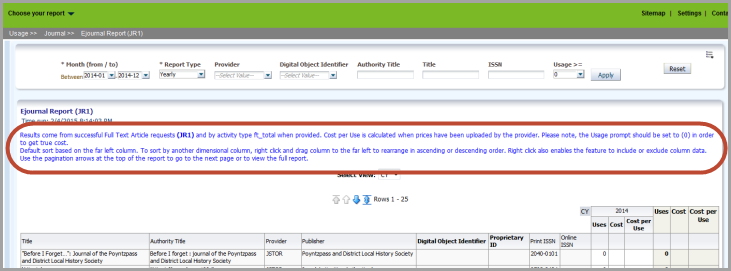
Once the report is generated, some general navigation information is displayed below the report title, such as what you see in the below Ejournal Report:
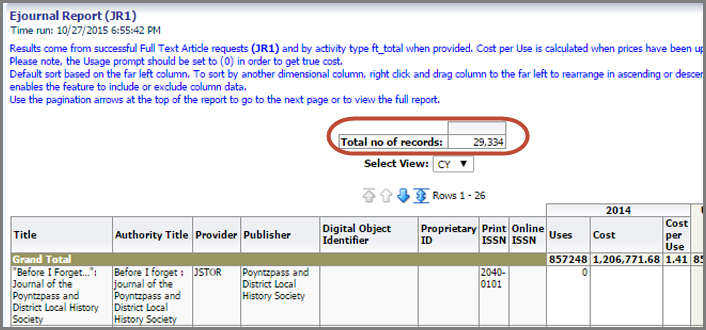
The total number of records in the report is displayed at the top, as seen in this Ejournal Report (JR1):
Navigating the Data in a Report
Rows 1 - 25 display by default, to view the next 25 rows click the left blue pagination arrow below, to view the maximum number of rows per page (5,000) click the right blue pagination arrow.
-
Note that the total number of pages in a report is not displayed on the screen. While the Total Number of Records is stated above the blue arrows, dividing the number by 5,000 does not represent the number of pages because the Total Number of Records is an internal processing value used by the system. We are currently unable to hide this field without negatively impacting other aspects of the report display.
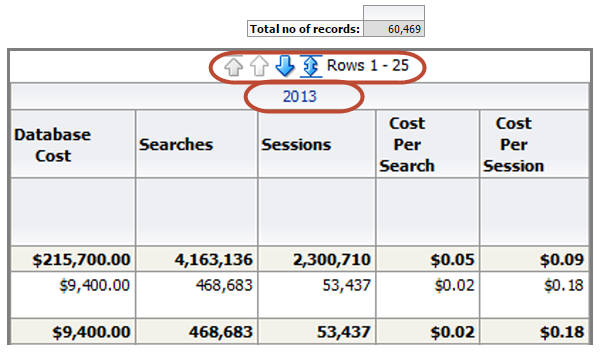
To quickly drill down by calendar year, quarters, and months, start by clicking on a year column header (2013) as seen above.
Use the filters at the very top of the page (for example Period and Provider) to select a different set of data, and then click Apply to run the updated report (use the Reset button to clear the fields). Available filters vary by report.
Note that if you drill down to a more specific data set, and then want to return to the previous, broader data set, you will need to re-create the report because the browser back button will take you to the default report state.
Working with Columns in a Report
Working with columns can vary by report. For most reports you can hover over a column to display Sort Ascending and Sort Descending arrows.
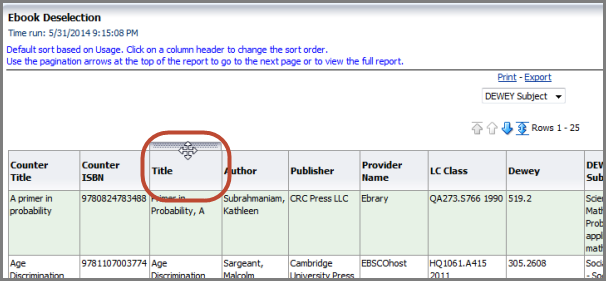
A column can be moved by hovering over a column header to display the bar above the column header. Move your mouse over the bar so that the directional icon displays (see below). Click and drag the column to where in the report you want to place it.
Right-click on a column header to expose options such as re-order, remove column data, and add subtotals. Here I have right-clicked on the Database Cost column header, the column color is now gray and my options are displayed:

Report Options Such as Customizations and Exporting
Use the Page Options icon on the right side of a report to:

-
Apply Saved Customization: If you have previously saved custom versions of the report, you can select them here.
-
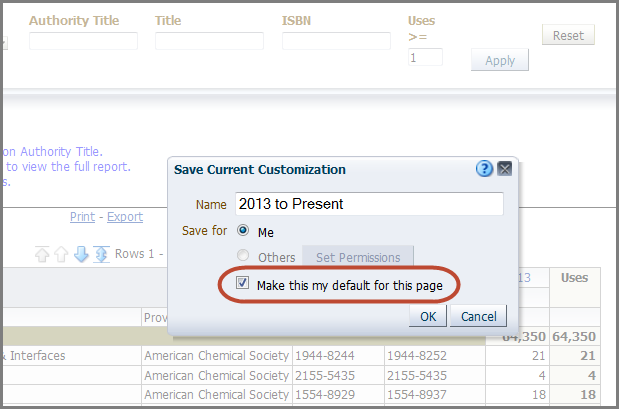
Save Current Customization: Make the custom version of the report available to you and/or others. When the Save Current Customization window opens, select the checkbox to make the custom version the default view for this report.
-
Edit Saved Customizations: Rename, delete, and control group access to the custom versions you have created for the report.
-
To delete a saved customization when the Edit Saved Customizations window opens up, click on the customization to highlight the row and activate the red 'X' that displays on the right side of the window. Click the 'X' to delete the saved customization.
-
-
Clear My Customization: If you are viewing a customized version of a report, use this option to start over with the default report.
Note that after an Intota Assessment release update, you may need to clear the cache in your browser in order for the Page Options menu to display properly.
If you have desired customizations that cannot be accomplished by customizing an available Intota Assessment report, you can build a report from scratch by using the Build Your Own Reports tool.
Print and Export
At the bottom of a report you will find Print and Export links:

A printable PDF is available.
Export options include :
-
PDF
-
Excel
-
PowerPoint
-
Data
-
CSV, Tab Delimited, or XML
-
Working with a report in Excel:
-
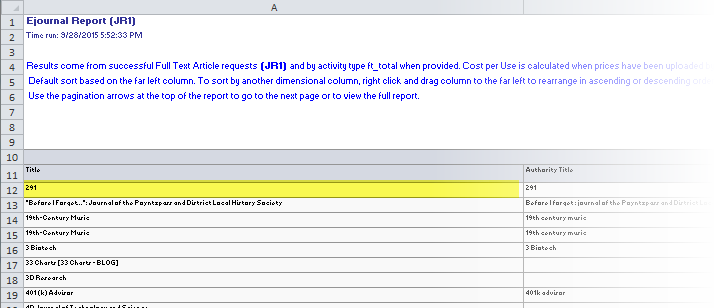
To sort the data in a report, yet retain the rows of header information at the top of the Excel spreadsheet, use Excel's CTRL+SHIFT_END keyboard shortcut:
-
Select the first cell of data (cell A12 in the below Ejournal Report example).
-
-
Press CTRL+SHIFT+END to extend the selection of cells to the last used cell on the worksheet (lower-right corner).
-
Now use Excel's Sort tool to sort the data however you desire. By default the My data has headers checkbox in Excel's Sort window should be un-checked; if the checkbox happens to be selected, de-select it so that Excel sorts only the data.
-
Date Created: 31-May-2014
-
Last Edited Date: 9-Dec-2015
-
Old Article Number: 10820

