
Overview of Primo VE Analytics
For details regarding Alma Analytics, which is used to report library operations, see Alma Analytics.
Related Webinars and Training
-
Additional Primo VE Training > 01 Introduction to Primo Analytics (5 min)
-
Additional Primo VE Training > 02 Dashboards and Reports (11 min)
-
Additional Primo VE Training > 03 Copying an Analysis to My Dashboard (7 min)
-
Additional Primo VE Training > 04 Editing an Analysis on My Dashboard (6 min)
-
Additional Primo VE Training > 05 Creating a New Analysis (6 min)
-
Additional Primo VE Training > Analyzing Device Usage with Primo Analytics and Data Visualization (6 min)
-
Additional Primo VE Training > Displaying a Map Visualization with Primo Analytics Data Visualization (10 min)
Terminology
The following table describes various terms used for Primo Analytics and its user interface.
| Term | Description |
|---|---|
|
Attribute |
A column in subject areas that holds a flat list of values that are also known as members. |
|
Dashboard |
A personal collection of Analytics reports that may be viewed at a glance. The Example Dashboard includes tabs for the following reports:
The Trends Dashboard includes the Actions and Popular Searches reports as described above. For information on how create reports and dashboards, see the following documents, respectively:
|
|
Dimension |
Tables that contain descriptive attributes (or fields) that are typically textual fields or discrete numbers behaving like text. Dimension attributes such as Dates, Action Types, or Institutions give facts a context. |
|
Fact Table |
Consists of the measurements, metrics, or facts related to a type of usage or process and contains the core part of the subject area. |
|
Hierarchical Attribute |
An attribute holds data values that are organized in a hierarchy. This kind of attribute is displayed using a treelike structure. Individual members are shown in an outline manner, with lower-level members rolling into higher- level members. |
|
Measurement |
A column of data in subject areas that holds a simple list of data values that can change or can be counted or aggregated in some way. |
|
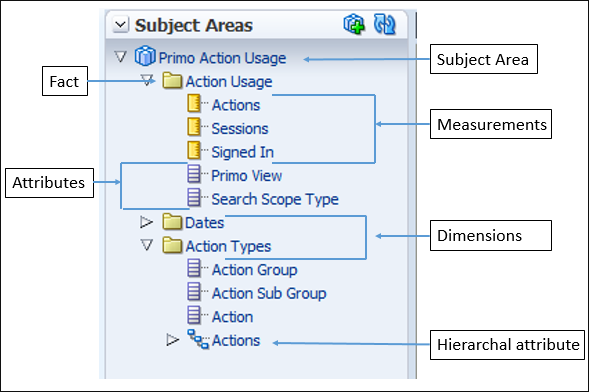
Subject Area |
Data in Primo Analytics that is organized into subject areas such as Action Usage and Popular Searches. Subject areas contain folders, measure columns, attribute columns, and hierarchical columns. For more information, see Analytics Subject Areas for Primo VE. |
The following diagram illustrates where some of these elements exist in Primo VE Analytics:
Accessing the Oracle Analytics Server for Primo VE
Primo VE Analytics is built on the Oracle Analytics Server (OAS), which enables you to create, run, and view reports/dashboards. Primo VE utilizes the same interface as Primo except for the operations activities, which are not applicable to Primo VE. For a thorough description of all the activities available in OAS, select the Help button to view the online help and Oracle documentation. For more information about OAS, see the following documents:
-
What's New in Analytics with OAS (Oracle Analytics Server) in the Ex Libris Developer Network
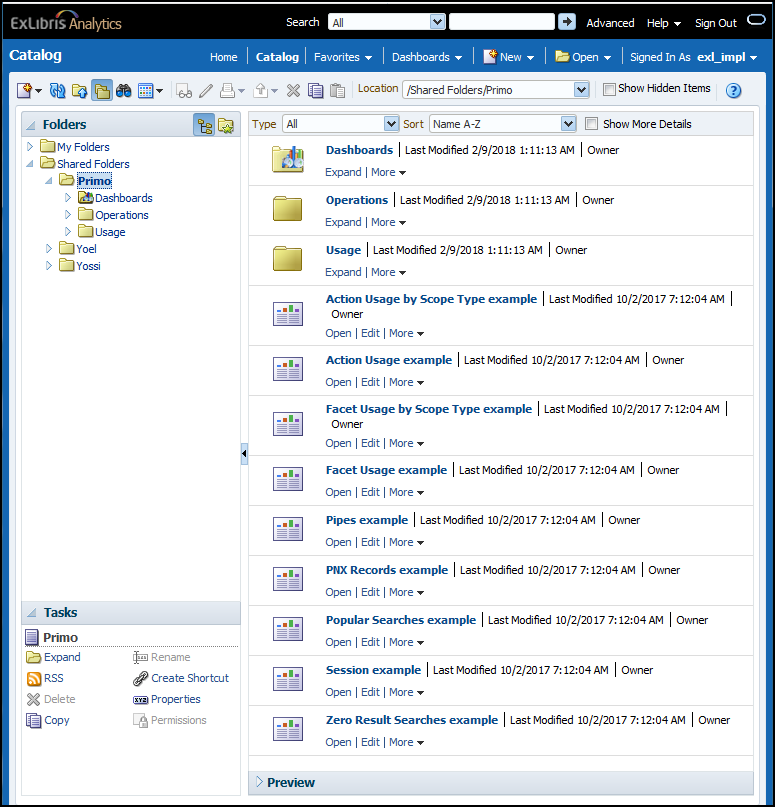
Select Analytics > Analytics > Design Analytics (Primo).
Configuring Analytics Objects for Primo VE
The Analytics and Configuration page (Analytics > Analytics Objects > Analytics Objects Lists) enables you to configure Analytics objects that link to Analytics reports and dashboards previously created in Primo Analytics. Once an object is created, staff users can add these objects to their home page in Alma.
For more details on how to create and use Analytics objects, see the following pages in Alma:
-
Working with Analytics Objects
You will need the Analytics Administrator role to access the Analytics and Configuration page and create objects.
-
Open the Analytics Configuration and Subscription page (Analytics > Analytics Objects > Analytics Objects Lists).
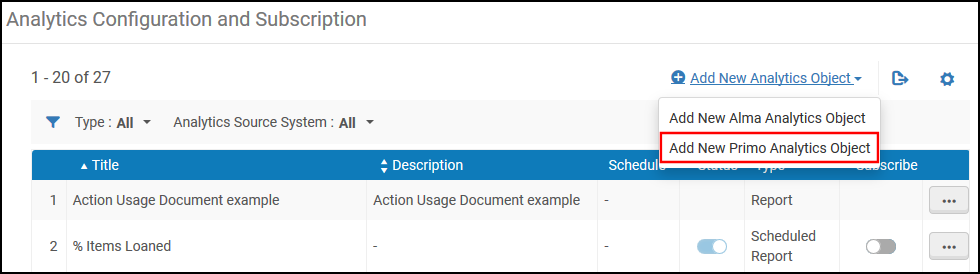 Analytics Configuration and Subscription (Administrator Page)
 -
Select Add New Primo Analytics Object from the Add New Analytics Object drop-down list.
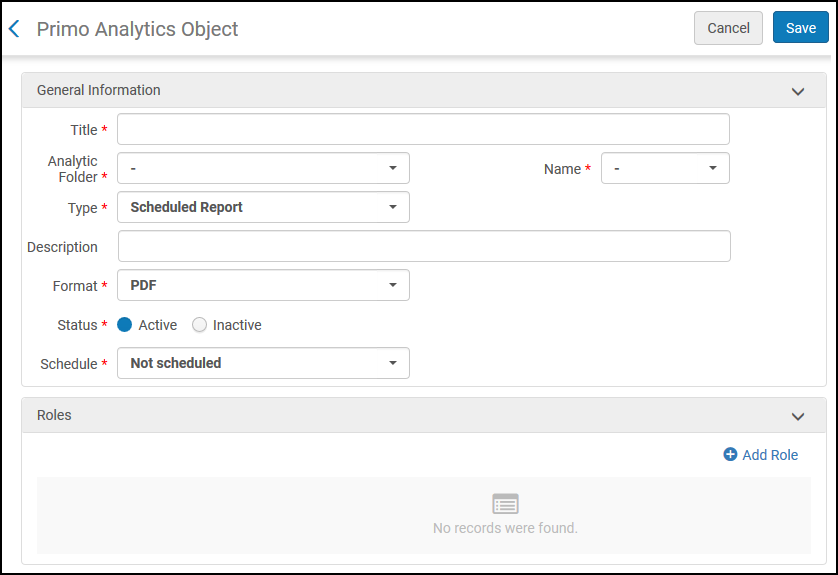 Add Primo Analytics Object
 -
Fill in the following fields:
-
Title (mandatory) – The title of the object to create.
-
Analytic Folder (mandatory) – The folder of the report or dashboard.
Analytics objects of type Widget, Report and Scheduled report should be defined from the Analytics institutional directory and not from the Primo directory. If the desired Analytics report is in the Primo directory, copy the report to your institutional directory and define the Analytics object from there. For example, if your institution is named Alma University and you want to define the default out-of-the-box report Shared Folders/Primo/Usage/Reports/Action Usage example as a widget, you should first copy it to a directory under Shared Folders/Alma University/ (such as Shared Folders/Alma University/Usage). The report can be copied from one directory to another either by opening it in edit mode, selecting Save as, and saving it in the new directory, or by dragging it from one directory to another (while ensuring that it remains in the previous directory as well—for example, by pressing the CTRL key).
-
Name (mandatory) – The name of the report or dashboard. The list of names comes from the folder you selected. Note that folder, report, or dashboard names should not contain the following characters: ampersands (&), commas (,), semicolons (;), colons (:), hashtags (#), or slashes (/).
-
Type (mandatory) – The object that you want to create.
-
Dashboard – A link to view a dashboard in Analytics > Reports.
-
Report – A link to view a report in Analytics > Reports.
-
Scheduled Dashboard – A scheduled dashboard. If you select this, the Status and Schedule fields appear.
-
Scheduled Report – A scheduled report. If you select this, the Format, Status, and Schedule fields and the FTP checkbox appear.
-
Widget – A widget for a report or dashboard. For information on how to display widgets in Alma, see Managing Widgets.
-
-
Format (scheduled report only, mandatory) – The format for the report: PDF, Excel, or Text. When the file size is over 2MB, it is compressed into a zip file.
-
Status (mandatory) – Whether the schedule is Active or Inactive.
-
Schedule (mandatory) – The time and period (daily, weekly or monthly) that you want the report or dashboard to be run. Scheduled reports and dashboards are run by the scheduled jobs Schedule of Analytics Reports and Dashboards. To run, the report must be enabled and scheduled here, and the job that runs reports at the selected time period must be enabled. Scheduled times are relative to your institution's time zone. When scheduled, the Email Notifications action appears.
-
FTP – Select FTP to have scheduled analytics reports placed on an FTP server. If you select this, the FTP Configuration and Sub-directory fields appear.
-
FTP Configuration – Select the FTP configuration on which to place the report. For information on configuring this, see Configuring S/FTP Connections.
-
Sub-directory – The sub-directory in which you want to place the report on the FTP server.
-
Select Email Notifications to configure who is notified when the job is complete. The Email Notifications for Scheduled Jobs appears. For more information, see Configuring Email Notifications for Scheduled Jobs.
Email notifications are sent for a scheduled time and not for each report or dashboard.
-
Description – A description for the report or dashboard.
-
-
(mandatory) You must have the roles required to subscribe to a scheduled report/dashboard or to view the link or widget of a report/dashboard: Select Add Role, select the roles that can subscribe or access the link or widget, and select Add Role. To remove a role, select Delete in the row actions list. Users must have at least one of the roles defined for the object to subscribe to or view the object.
-
Select Save.
Subscribing to Scheduled Reports and Dashboards for Primo VE
Staff users who are assigned any of the roles specified in the scheduled report/dashboard may subscribe to a scheduled report/dashboard using the Analytics Configuration and Subscription page (Analytics > Analytics > Subscribe to Analytics).
Administrators can also add and delete subscriptions for staff users who do not have the required permissions to subscribe themselves. For more information, see Scheduling and Subscribing to Reports and Dashboards.
-
Open the Analytics and Configuration page (Analytics > Analytics > Subscribe to Analytics).
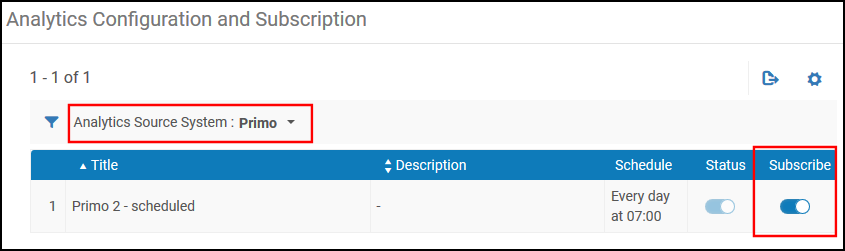 Analytics Configuration and Subscription (Subscriber Page)
 -
Select the Primo filter from the Analytics Source System drop-down list.
-
In the row of the report/dashboard to which you want to subscribe, enable the slider in the Subscribe column.