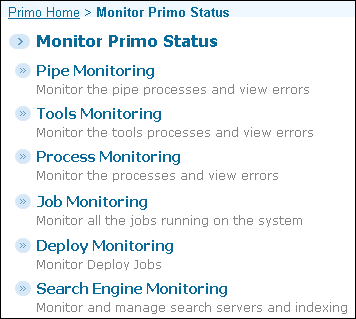
Monitoring Primo Status
Pipe Monitoring
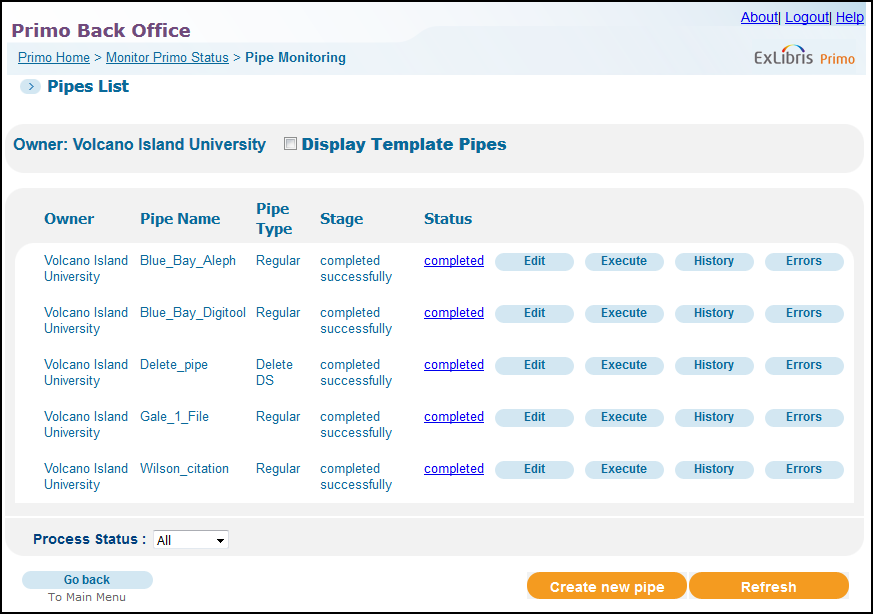
The Pipes List page (Primo Home > Monitor Primo Status) lists the pipes that are configured in Primo. You can filter the pipes by institution using the Owner drop-down list and include the pipe templates by selecting the Display Template Pipes check box.
Institution-level staff users can view pipes that are owned only by their institution.
The Status and Stage columns on the Pipes List page allow you to quickly determine the status of each pipe. The following table describes all of this page's columns and buttons.
| Component | Description |
|---|---|
|
Pipe Name |
This field contains the name of the pipe. |
|
Pipe Type |
This field indicates the type of pipe. For more information, see Define Pipe Details. |
|
Status |
This column displays the current status of the pipe. The following statuses may display:
Click the status to display more detailed information on the job. For more information, see Viewing a Pipe's Details. |
|
Stage |
This column displays which stage of the process the system is running for the pipe. The following stages may display:
|
|
Edit button |
This button provides access to the Define Pipe page, which allows you to modify the settings of a pipe. For more information, see Editing a Pipe. |
|
Execute button |
This button starts the execution of the pipe. During the execution of a pipe, the following stages are performed: Harvesting, NEP (which includes normalization, enrichment, and persistence), Dedup, Dedup merge, FRBR, and FRBR merge. Each pipe is run as a job, which you can monitor via the Job Monitor page. For more information, see Job Monitoring.
Log files for each pipe are stored in the harvest and log directories under the following directory on the Primo server, where <n> is the Primo copy: /exlibris/primo/p1_<n>/ng/primo/home/profile/publish/publish/production/pipes/<pipe_name/>
In addition, a general log file called publish_server.log is stored under the following directory: /exlibris/primo/p1_<n>/ng/primo/home/profile/publish/publish/production/log
If a pipe fails, an e-mail message is sent to the e-mail address specified in the Contact Person E-mail parameter (Primo Home > Advanced Configuration > General Configuration > E-mail and SMS Configuration) page. Pipe email addresses defined at the installation and institution levels in the E-Mail Addresses mapping table override the value specified in the Contact Person E-mail parameter. |
|
History button |
This button displays the Job Monitor page, which displays an entry for each execution of the pipe. For more information, see Viewing a Pipe’s History. |
|
Errors button |
This button displays the errors that occur during the execution of a pipe. For more information, see Viewing a Pipe’s Errors. |
|
Create New Pipe button |
This button provides access to the Define Pipe page, which allows you to add a pipe to the system. For more information, see Defining a Pipe. |
|
Delete button |
Deletes an existing pipe from the list. For more information, see Deleting a Pipe. This button does not appear after the pipe has been executed. |
Viewing a Pipe's Details
-
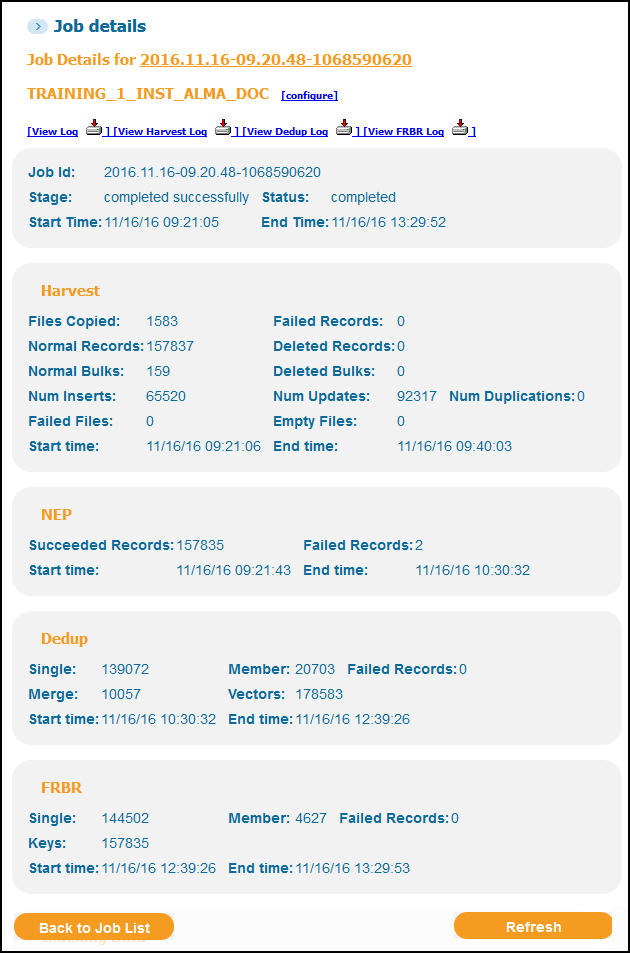
Pipe name and overall pipe status – includes the Job ID, stage, status, and start and end times. To view the Pipe's settings on the Define Pipe page, click Configure.
-
Harvest – This section displays the results of the harvest stage:
-
Files Copied – the number of files that were copied.
-
Failed Records – the number of failed records.
-
Normal Records – the number of inserted and updated records.
-
Deleted Records – the number of records that were marked for deletion.
-
Normal/Deleted Bulks – the number of normal and deleted bulks, respectively. Each bulk contains up to 1000 unique records, and a record may span multiple bulks.
-
Num Inserts – the number of new records that were harvested.
-
Num Updates – the number of updated records, which includes duplicate records that span across bulks.
-
Num Duplications – the number of duplicate records, which includes the duplicate records deleted from a bulk (only the latest record is saved in a bulk) and the duplicates that span other bulks.
-
Failed Files – the number of files that could not be completely processed due to parsing error. Note that some of the records in the file may have been saved to the M_P_SOURCE_RECORD database table, while the failed record is added to the count in the Failed Records field.
-
Empty Files – the number of empty files that were processed.
-
Start/End Time – the job’s start and end times, respectively.
-
-
NEP – includes the number of successful and failed records and the start and end times. In general, the sum of the NEP succeeded records and the NEP failed records should be equal to the number of harvested normal records. In some cases, the number of duplicate records may have some effect on the sum.
-
Dedup – includes the number of single records, member records (such as the number of records that belong to a dedup group), and merged records. In addition, this section displays the number of dedup vectors that were created in the NEP stage, and the start and end times.
-
FRBR – includes the number of single records, member records (such as the number of records that belong to a FRBR group), and merged records. In addition, this section displays the number of FRBR keys that were created in the NEP stage, and the start and end times.
| Button/Link | Description |
|---|---|
|
Resume button
|
Resumes the execution of a pipe that has been suspended by a user or has been stopped by the system due to an error. After a resume request, the work status changes to pending resume and will not resume immediately. Execution will begin when process activity decreases.
Resume tries to restart the work from its last point of execution for most cases. Otherwise, it will resume from a previous stage.
During a resume, Primo loads and processes bulks that were previously failed, but it does not process individual failed records.
If a pipe is stopped during the harvest stage, a status of stopped harvest error is returned. Since a pipe cannot be resumed when it is stopped in the harvest stage, you can terminate the pipe and then restart it.
If there were many failed records as a result of problems in normalization, the best solution is to terminate the pipe, fix the normalization rules, and then execute the pipe again. This will override previous changes to the database and update records that were already saved.
This option is not recommended and has been deprecated.
|
|
Suspend button
|
Suspends a running pipe. When a pipe is suspended, the work status changes to pending suspend, and when it completes, the status changes to suspended. A suspend request is not permitted during the harvest phase.
This option is not recommended and has been deprecated.
|
|
Terminate button
|
Stops the execution of a currently running pipe.
|
|
Configure link
|
Used to modify a pipe’s definition. For more information, see Editing a Pipe.
|
|
View Log link
|
Displays the errors and processes that occurred during each stage of the pipe's execution except for the Harvest stage.
|
|
View Harvest Log link
|
Displays the errors and processes that occurred during the Harvest stage.
|
|
View Dedup Log link
|
Displays the errors and processes that occurred during the Dedup stage.
|
|
View FRBR Log link
|
Displays the errors and processes that occurred during the FRBR stage.
|
|
Restore Files link
|
Restores the harvested files to the original directory so that the pipe can be run again from scratch. This link displays only for a pipe job that is associated with a pipe that is marked as Delete after copy and its current status is stopped error, threshold exceeded error, or terminated.
The Restore Files option is not relevant for OAI harvesting.
|
-
On the Back Office’s home page, click Monitor Primo Status.The Monitor Primo Status page opens.
-
Click Pipe Monitoring on the Monitor Primo Status page.The Pipe Monitoring page opens, showing the lists of pipes.
-
Click the Process Status link next to the pipe you want to monitor to display the Job Details page.
Viewing a Pipe’s History
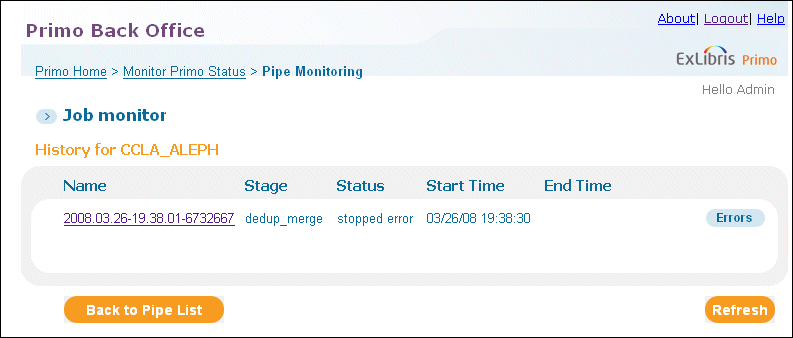
-
View error information by clicking an Errors button next to a job in the list.
-
View job details by clicking a link in the Name column.
-
On the Back Office’s home page, click Monitor Primo Status.The Monitor Primo Status page opens.
-
Click Pipe MonitoringThe Job Monitor page displays the list of jobs.
-
Click History next to the job that you want to view.
Viewing a Pipe’s Errors
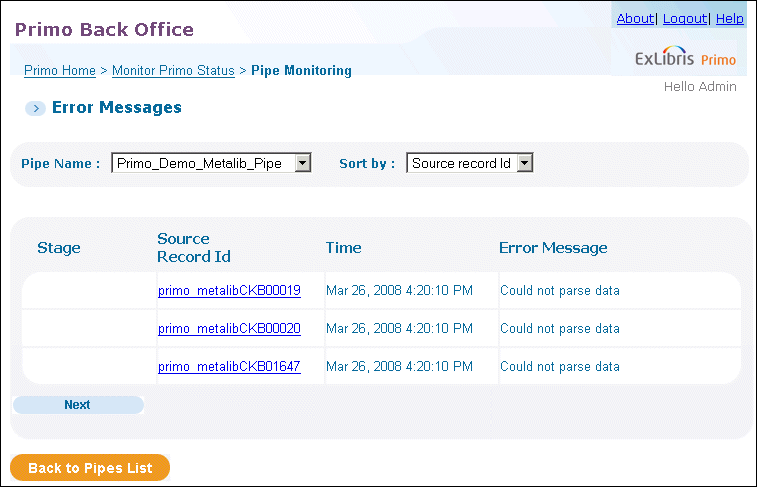
-
On the Back Office’s home page, click Monitor Primo Status.The Monitor Primo Status page opens.
-
Click Pipe Monitoring.The Pipe Monitoring page opens, showing the list of pipes.
-
Click Errors next to the pipe whose errors you want to view.The Errors page opens, showing the error details for the specified pipe.
-
Click the link in the Source Record Id column to view the source record.The errors that occur most frequently are listed in the following table:
Errors While Running the Pipes Error How to Solve the Problem TEMP table space is full in oracleTalk to your DBA about increasing the TEMP table space.TS_P_DAT table space is fullThe table space used for storing Source Records and PNX is full. Talk to your DBA about increasing the TS_P_DAT table space.The Oracle user lacks privileges (this is important during the initial dedup stage)Talk to your DBA to give create any directory privileges to the primo_library Oracle role.No physical disk space left on the production directory partitionFile system for storing bulk zip files is full.Talk to your System Administrator about increasing the available disk space.Input data is not in a valid XML formatThe source data is not valid XML. Check with the owner of the source system.Input records are missing mandatory fieldsThe source data is missing mandatory fields: sourcerecordid, sourceid, recordid, type, title, and delcategory. For example:Invalid content was found starting with element 'creationdate'. One of '{"":title}}' is expected.The part "[...] One of '{"":title}}' is expectedThis indicates that the required display/title field could not be created for the record. To diagnose this problem, check the source record and the normalization rules.In some cases, you may need to check with the owner of the source system.The source directory is not open for reading by the Primo userThe source directory accessed by Primo by the pipe Harvesting module is not accessible for viewing.Talk to your System Administrator.Files in source directory have an earlier modification date than pipeThe harvesting date on the file must be more recent than the date configured for the pipe.Talk to your System Administrator and/or owner of the source system. -
On the Errors Messages page, click Back to Pipes List to return to the Pipe Monitoring page.
Tools Monitoring
For information on how to create tools, see Primo Tools.
Although you can monitor all tool jobs for your institution, you are permitted to create and execute the following tools only: Generate Sitemap, Delete Sitemap, Export Primo configuration, and Import Primo configuration.
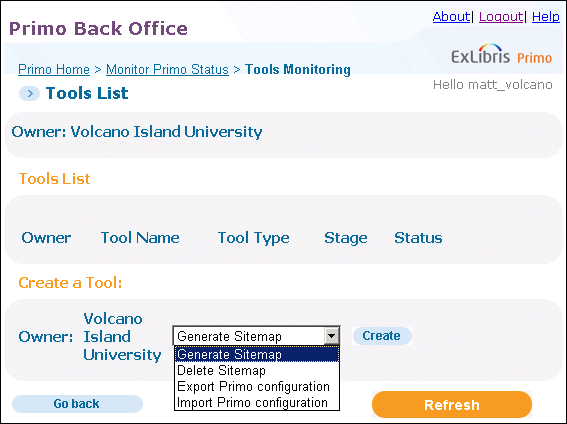
-
Execute the tool – Click the Execute button to run the tool. After you have executed the tool, you can monitor its progress on the Tools List page.
-
Edit the tool – Click the Edit button to open the configuration page for the selected tool. For more information on each type of tool, see Primo Tools.
-
View the log file – Click the History button to view the log file. For more information, see Tools History List.
Tools History List
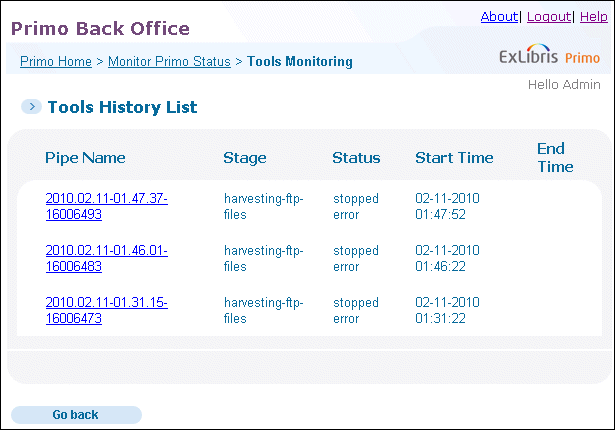
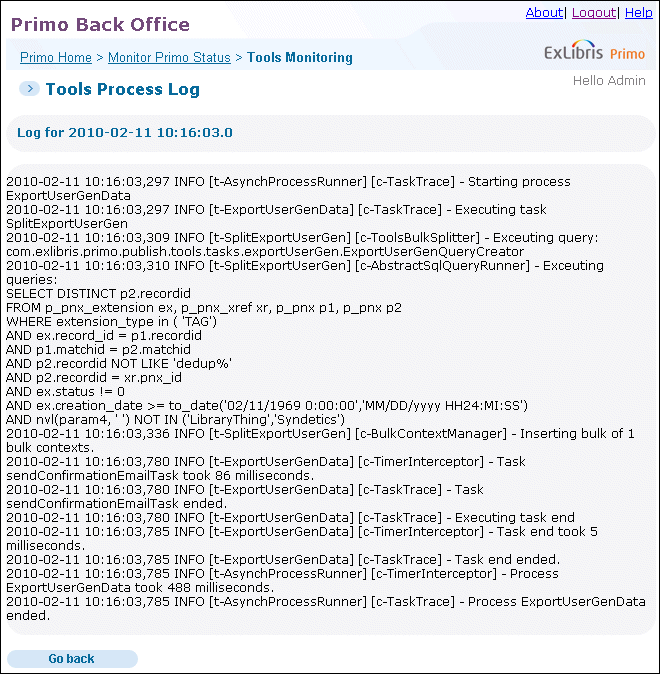
- Pipe Name – This column displays the name of the tool’s process. Click this link to display the tool’s log. For more information, see Tools Process Log.
- Stage – This column displays the execution stage of the tool.
- Status – This column displays the overall status of the tool.
- Start/End Time – These columns display the start and end times of the tool’s execution.
Process Monitoring
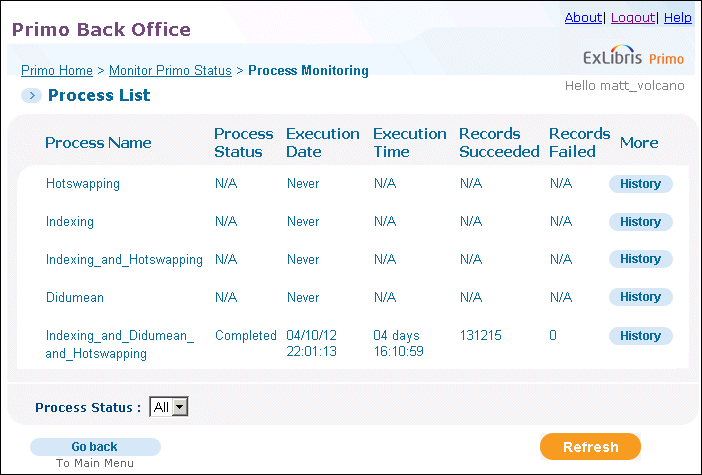
-
View the process history – Click the History button to view the log for the process.
-
Execute the process – Click the Execute button to run the process. After you have executed the process, you can monitor its progress on the Process List page (on-premises installations only).
-
Clean up the process – Click the Clean-up button to delete the history of the process and any jobs waiting for execution in the queue (on-premises installations only).
-
On the Back Office’s home page, select Monitor Primo Status.The Monitor Primo Status opens.
-
Click Process Monitoring.The Process Monitoring page displays the list of processes. For details on ongoing indexing, see Ongoing Indexing.
Job Monitoring
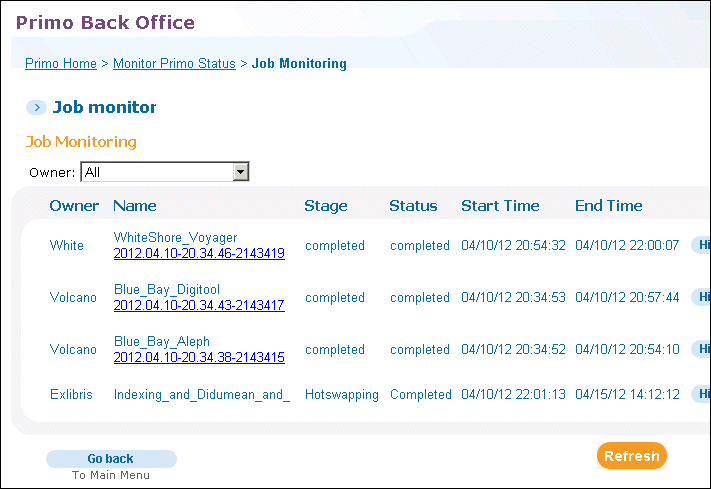
-
View history information by clicking the History button next to the relevant job.
-
View error information by clicking the Error button next to the relevant job.
-
View detailed job information by clicking the link in the Name column.
Deploy Monitoring
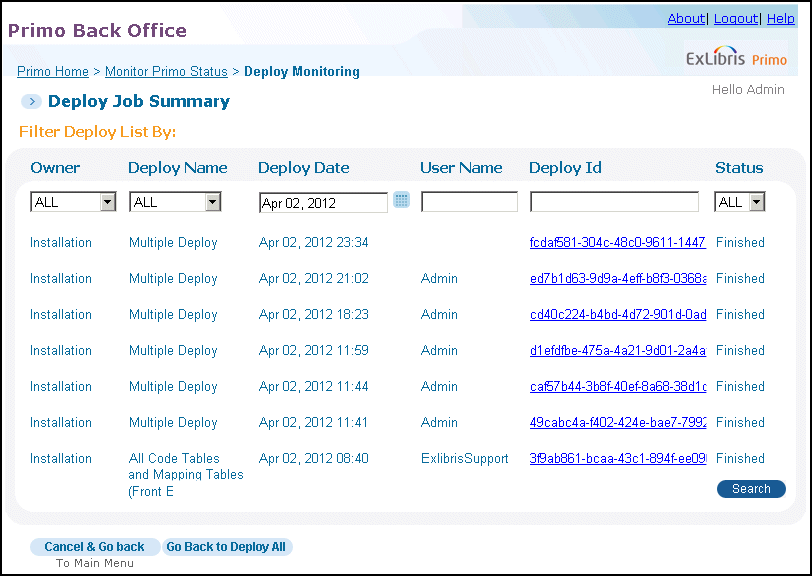
-
Click the links in the Deploy ID column to display the log for the corresponding deploy job.
-
Click Go Back to Deploy All to perform a new deploy on the Deploy All page.
-
On the Deploy Job Summary page (see Filter Deploy List Page), use the information in the following table to filter the deploy jobs for a specified day.For installation-level staff users, select the installation name or a specific institution from the Owner drop-down list. The valid values are Installation (if using the default name) or a specific institution.For institution-level staff users, the Owner field is set to your institution.
Deploy Job Summary Details Field Description Deploy NameIndicates the type of deploy the system has run. You can click this link to display the log. If the job is still running or has failed, the system automatically displays the log.Deploy DateThe date on which the deploy job was executed. The system displays the jobs for the current day by default.User NameThe user name of the staff user that executed the deploy job.Deploy IDThe deploy ID process. You can click this link to open the Deploy Log Details page for the corresponding deploy job.StatusThe status of the deploy job. The following statuses are possible:-
Failed – The deploy job has failed. Refer to the Deploy Log Details for more information. For example, a deploy will fail if the target servers are down.
-
Finished – The deploy job has finished without errors.
-
Running – The job is still running.
-
Waiting – The job is waiting in the queue to be executed.
-
-
Click Search to filter the jobs as specified.
-
Click a link in the Deploy ID column to display the log for the corresponding deploy job. For more information, see Deploy Log Details Page.
Deploy Log Details Page
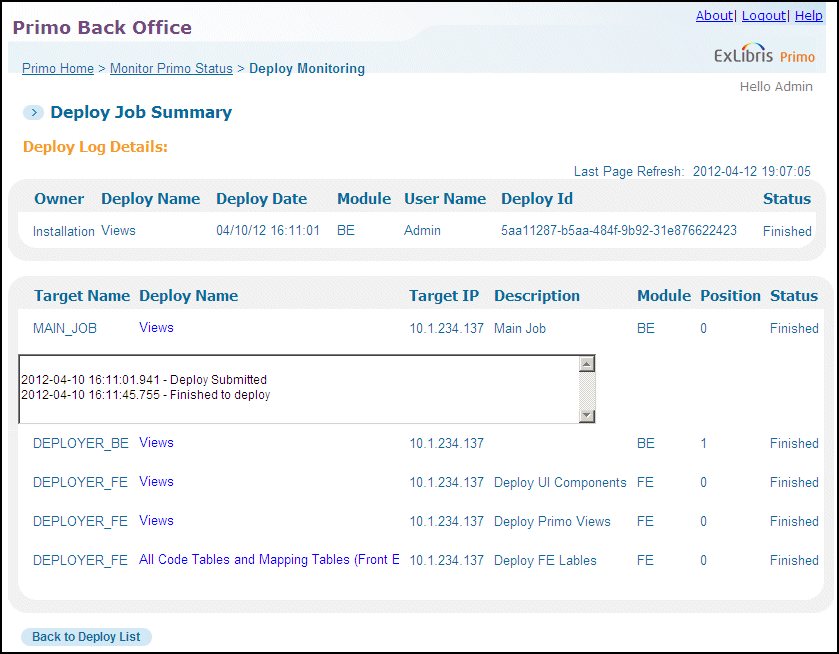
-
Target Name – The name of the stage in the deploy process, which includes the following stages:
-
MAIN_JOB – The first stage in the deploy process
-
DEPLOYER_BE – Deployment to the Back Office server.
-
DEPLOYER_FE – Deployment to the Front End server.
You may see multiple entries for DEPLOYER_BE and DEPLOYER_FE depending on the number servers and the types of configurations that were selected for the deploy job. -
-
Deploy name – The type of configuration that the system is deploying. You can click the Deploy name link to display the log. The system automatically displays the log if the stage is still running or has failed.
-
Target IP – The IP to which the configuration has been deployed.
-
Description – The description of the stage.
-
Module – The module indicates whether the stage took place in Back Office (BE), Front End (FE), or Search Engine (SE).
-
Position – The position of the deploy stage in the process queue
-
Status – The same statuses as for the deploy as a whole are possible
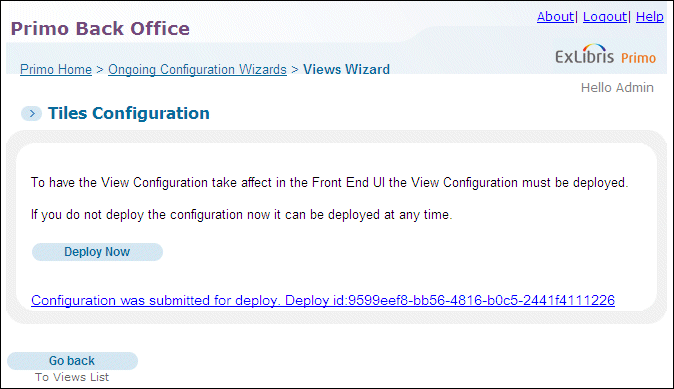
Wizard-Level Deploys
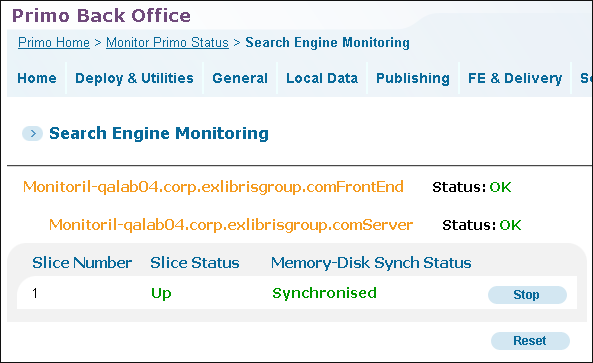
Search Engine Monitoring
| Field | Description |
|---|---|
|
Search Engine Name
|
The name of the agent that manages the group of slices. Each agent represents a search engine server. In this example, the search server name is Monitor il-primo03.corp.exlibrisgroup.comServer.
|
|
Status
|
The agent's status.
|
|
Slice Number
|
The slice's Id number. Each slice has a unique slice number which is used throughout the system.
|
|
Slice Status (on-premises installations only)
|
Indicates the status of each slice. The status is Up when the slice is available for use and the status is Down when the slice is unavailable for use. When the status is Down, the Stop button changes to Start.
If the slice is down, then something in the system is not functioning properly. Check your server log to figure out the problem. For more information on the server log, refer to the Primo System Administration Guide.
|
|
Memory-Disk Synch Status (on-premises installations only)
|
Each time an indexing of the records is performed, a new version of indexed records is created. After the new version of records is created but before the new records have been loaded into the memory and swapped with the old indexes, the Memory-Disk Status is Unsynchronized. Once the new versions of indexes are swapped with the old indexes in the memory, the Memory-Disk Status changes to Synchronized.
|
-
Reset – You can use the reset function to reload the server's agents who then load a new search schema. The reset function is generally only used if one of the servers has been modified, and is normally not used during production.
-
Deploy – You can use the deploy function to enable the agents to re-initialize themselves with their relevant schemas and then pass along the information received from the search schema. The deploy function is performed automatically and therefore is not necessary to use.
-
Silent deploy – The silent deploy function is the same as the deploy function in that it sends information to each of the agents to re-initialize themselves with their relevant schemas. The silent deploy function differs from the deploy function in that it does not send a command to execute the information received.
-
From the Back Office’s home page, click Monitor Primo status.The Monitor Primo Status page opens.
-
Click Search Engine Monitoring to display the Search Engine Monitoring page.
-
Next to the slice, click one of the following buttons:
-
Start – to make the slice available for use and change the slice's status to Up.The slice is available for use.
-
Stop – to make the slice unavailable for use and change the slice's status to Down.The slice is no longer available for use.During the regular process flow, the Stop function should never be used. When the Stop function is used, it indicates that a part of the system is not functioning properly and is unavailable for use.
Optionally, you can perform one of the following actions:-
Click Reset to reload the server's agents who then load a new search schema.The reset function is generally only used if one of the servers has been modified, and is normally not used during production.The agents and new search schema are loaded.
-
Click Deploy to enable the agents to re-initialize themselves with their relevant schemas and then pass along the information received from the search schema.The deploy function is performed automatically and therefore is not necessary to use.The agents are re-initialized and the relevant schemas information is executed.
-
Click Silent Deploy to send information to each of the agents to re-initialize themselves with their relevant schemas.
-
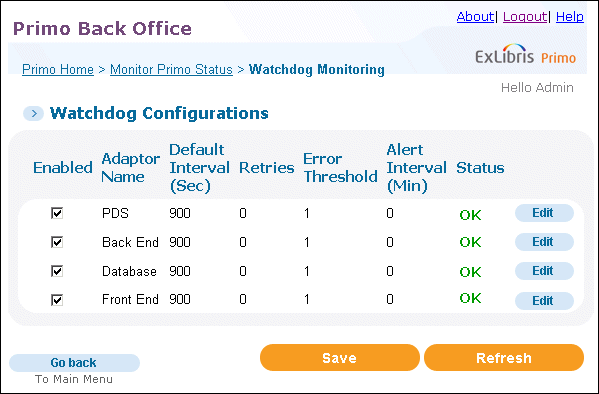
Watchdog Monitoring
-
Click Edit to update the configuration settings of a monitor.The Edit Watchdog Configuration page opens.
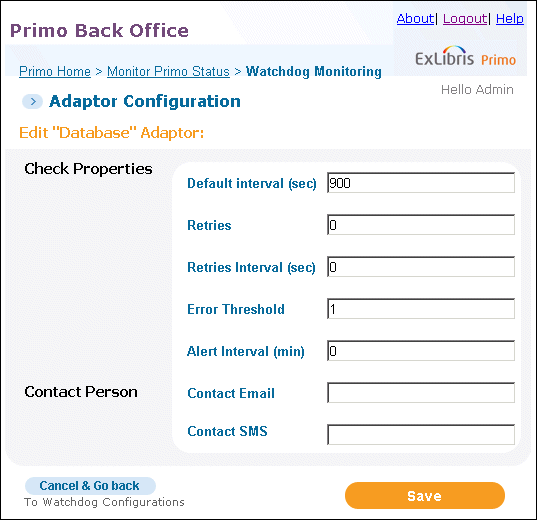 Edit Watchdog Configurations Page
 -
Enter the fields as described in Watchdog Configuration Details.
Watchdog Configuration Details Field Description Adaptor NameThe name of the monitor.Default Interval (sec)The time interval (in seconds) for availability checks.RetriesThe time interval (in seconds) for retries.Error ThresholdNotification will be sent only when the error threshold is met.Alert Interval (min)The minimum time interval (in minutes) between alerts if positive notification is not sent out.Contact EmailThe contact e-mail address. Multiple email addresses can be separated with a semicolon.Contact SMSThe SMS contact number. -
Click Save to save your updates.
-
Repeat this procedure for each monitor you would like to configure.


